Built-in analysis features
From AI-powered summaries to flexible filters and shareable results, Lyssna gives you the tools to find clarity, align your team, and move forward with confidence.
No credit card required

From raw feedback to real clarity — fast
Great research deserves smart analysis. With Lyssna, you can synthesize feedback, tag themes, surface key insights and share takeaways—all from a single, intuitive place.
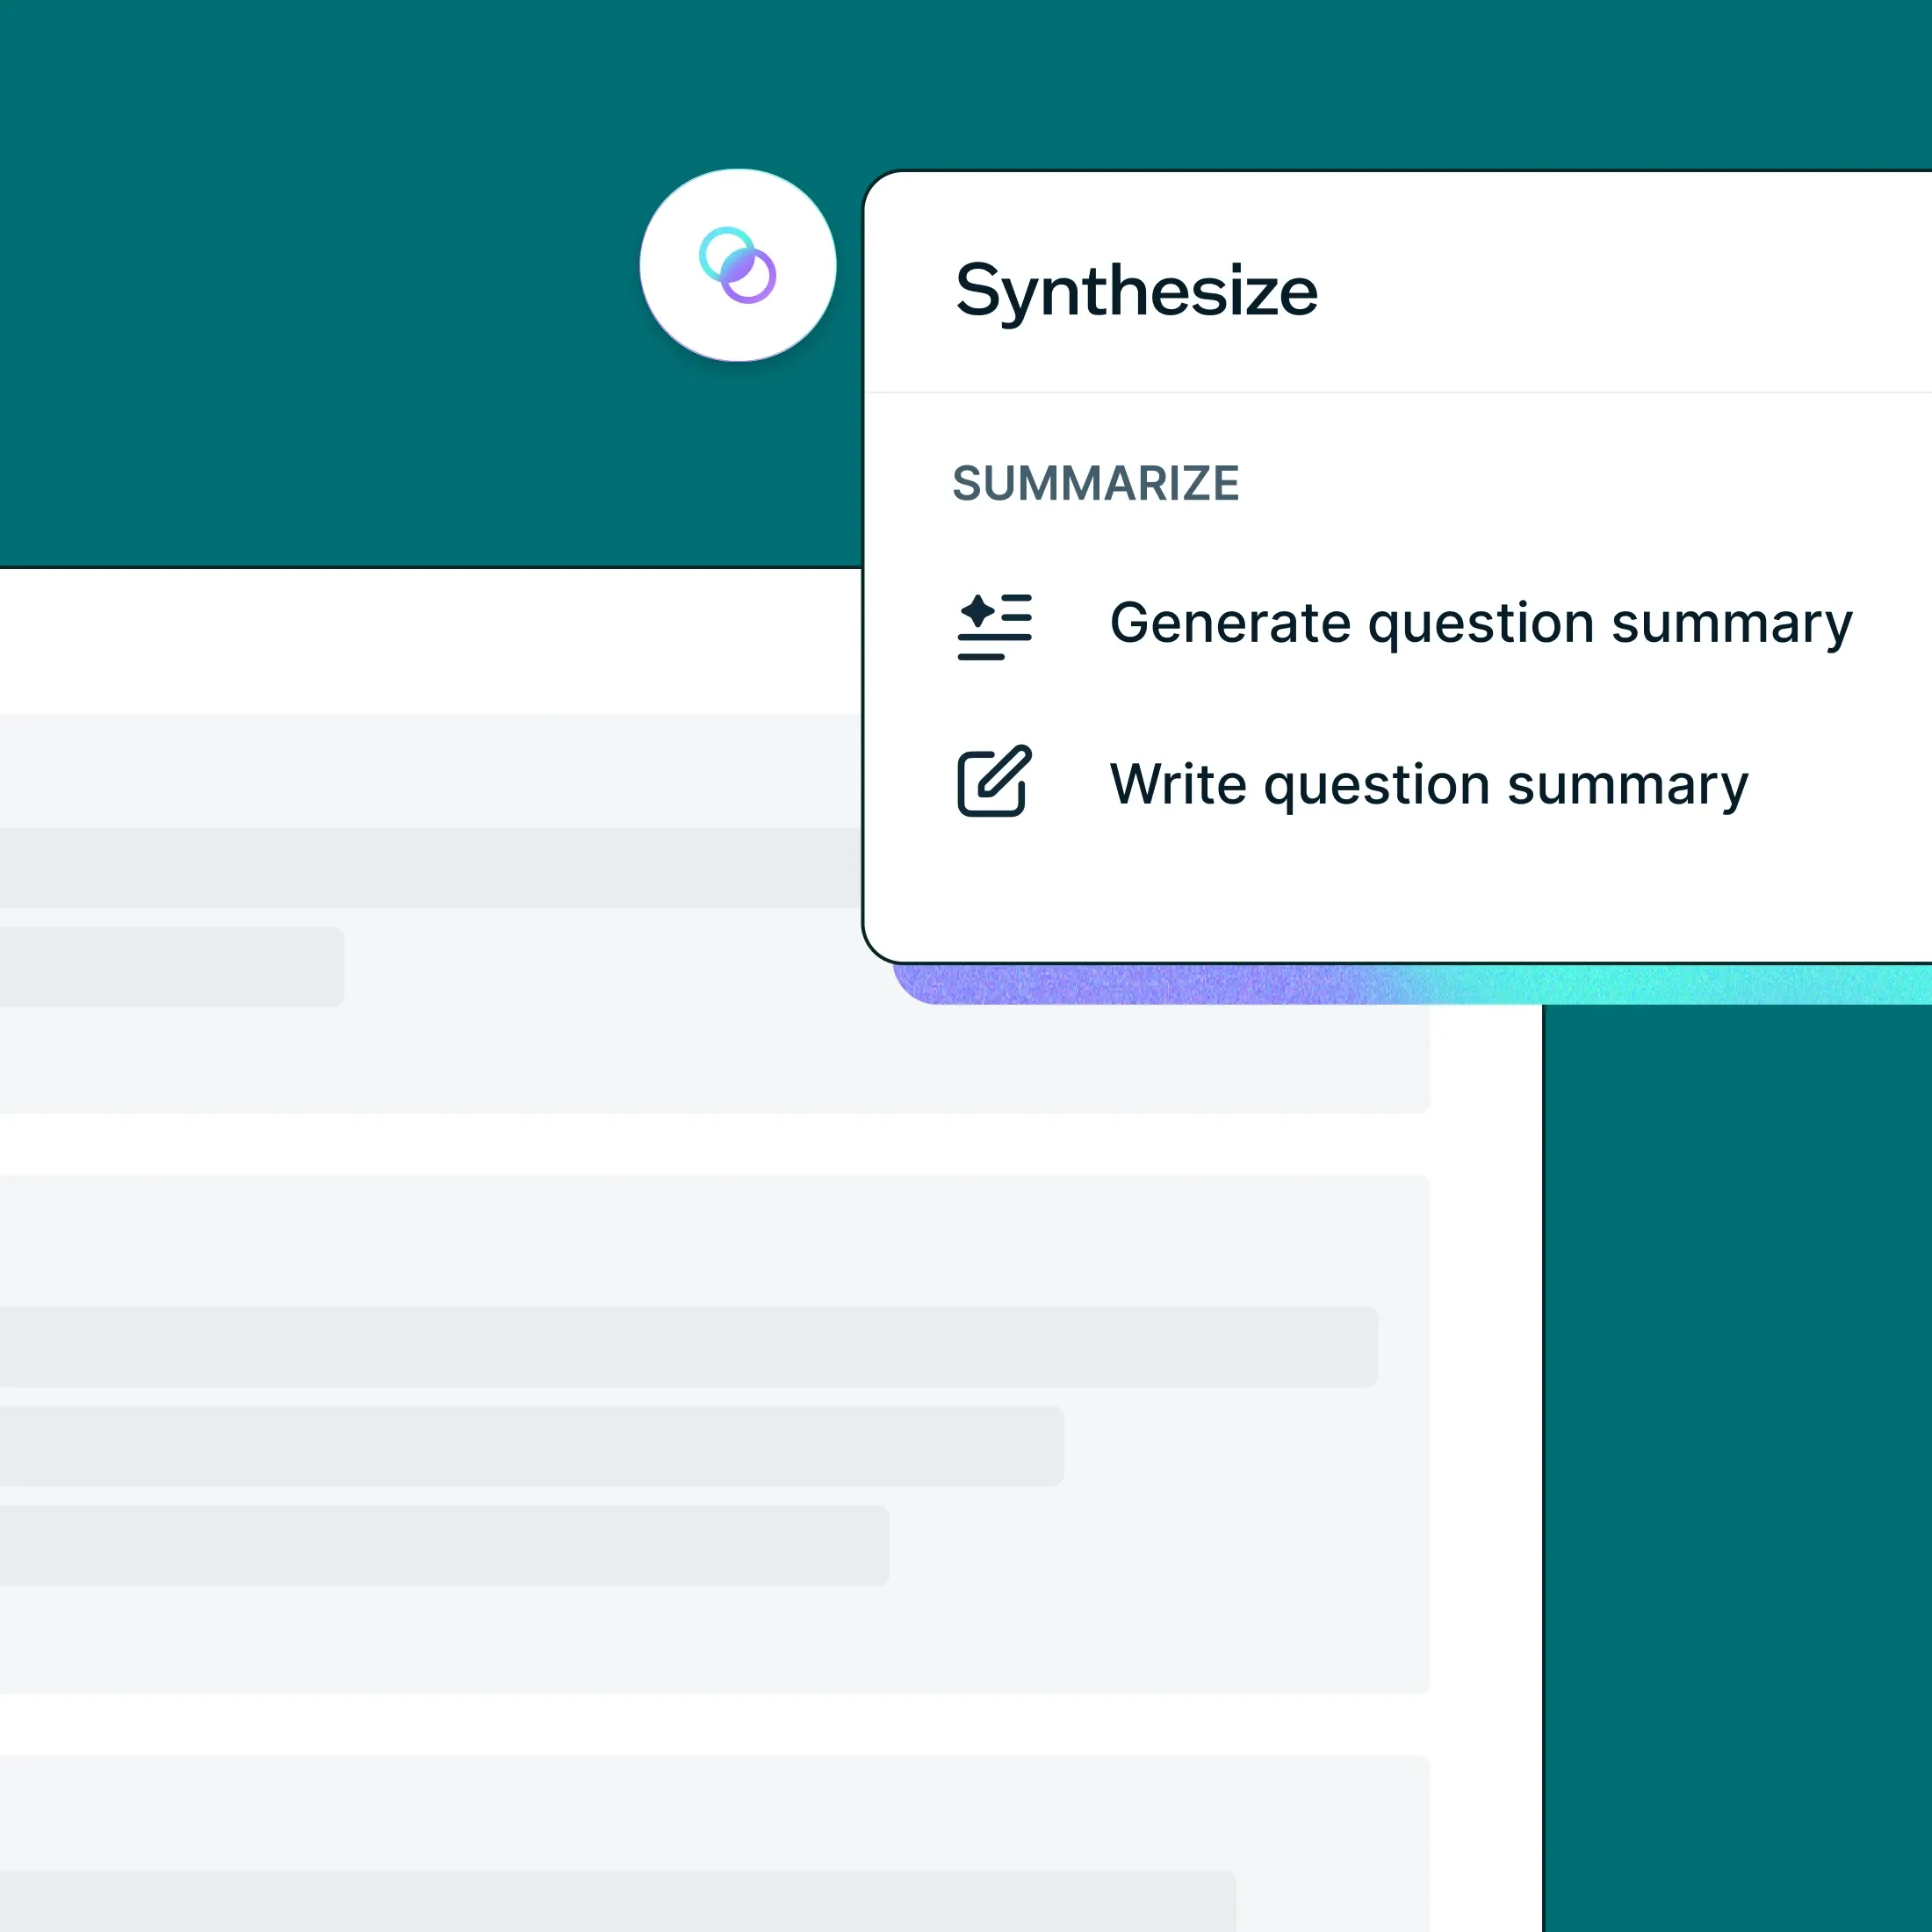
Synthesize findings with summaries
Distill pages of open-ended responses into structured, editable summaries with our Synthesize feature.
Generate AI summaries for open-text responses
Write manual summaries for any question type or for full studies
Apply summaries retrospectively to past studies
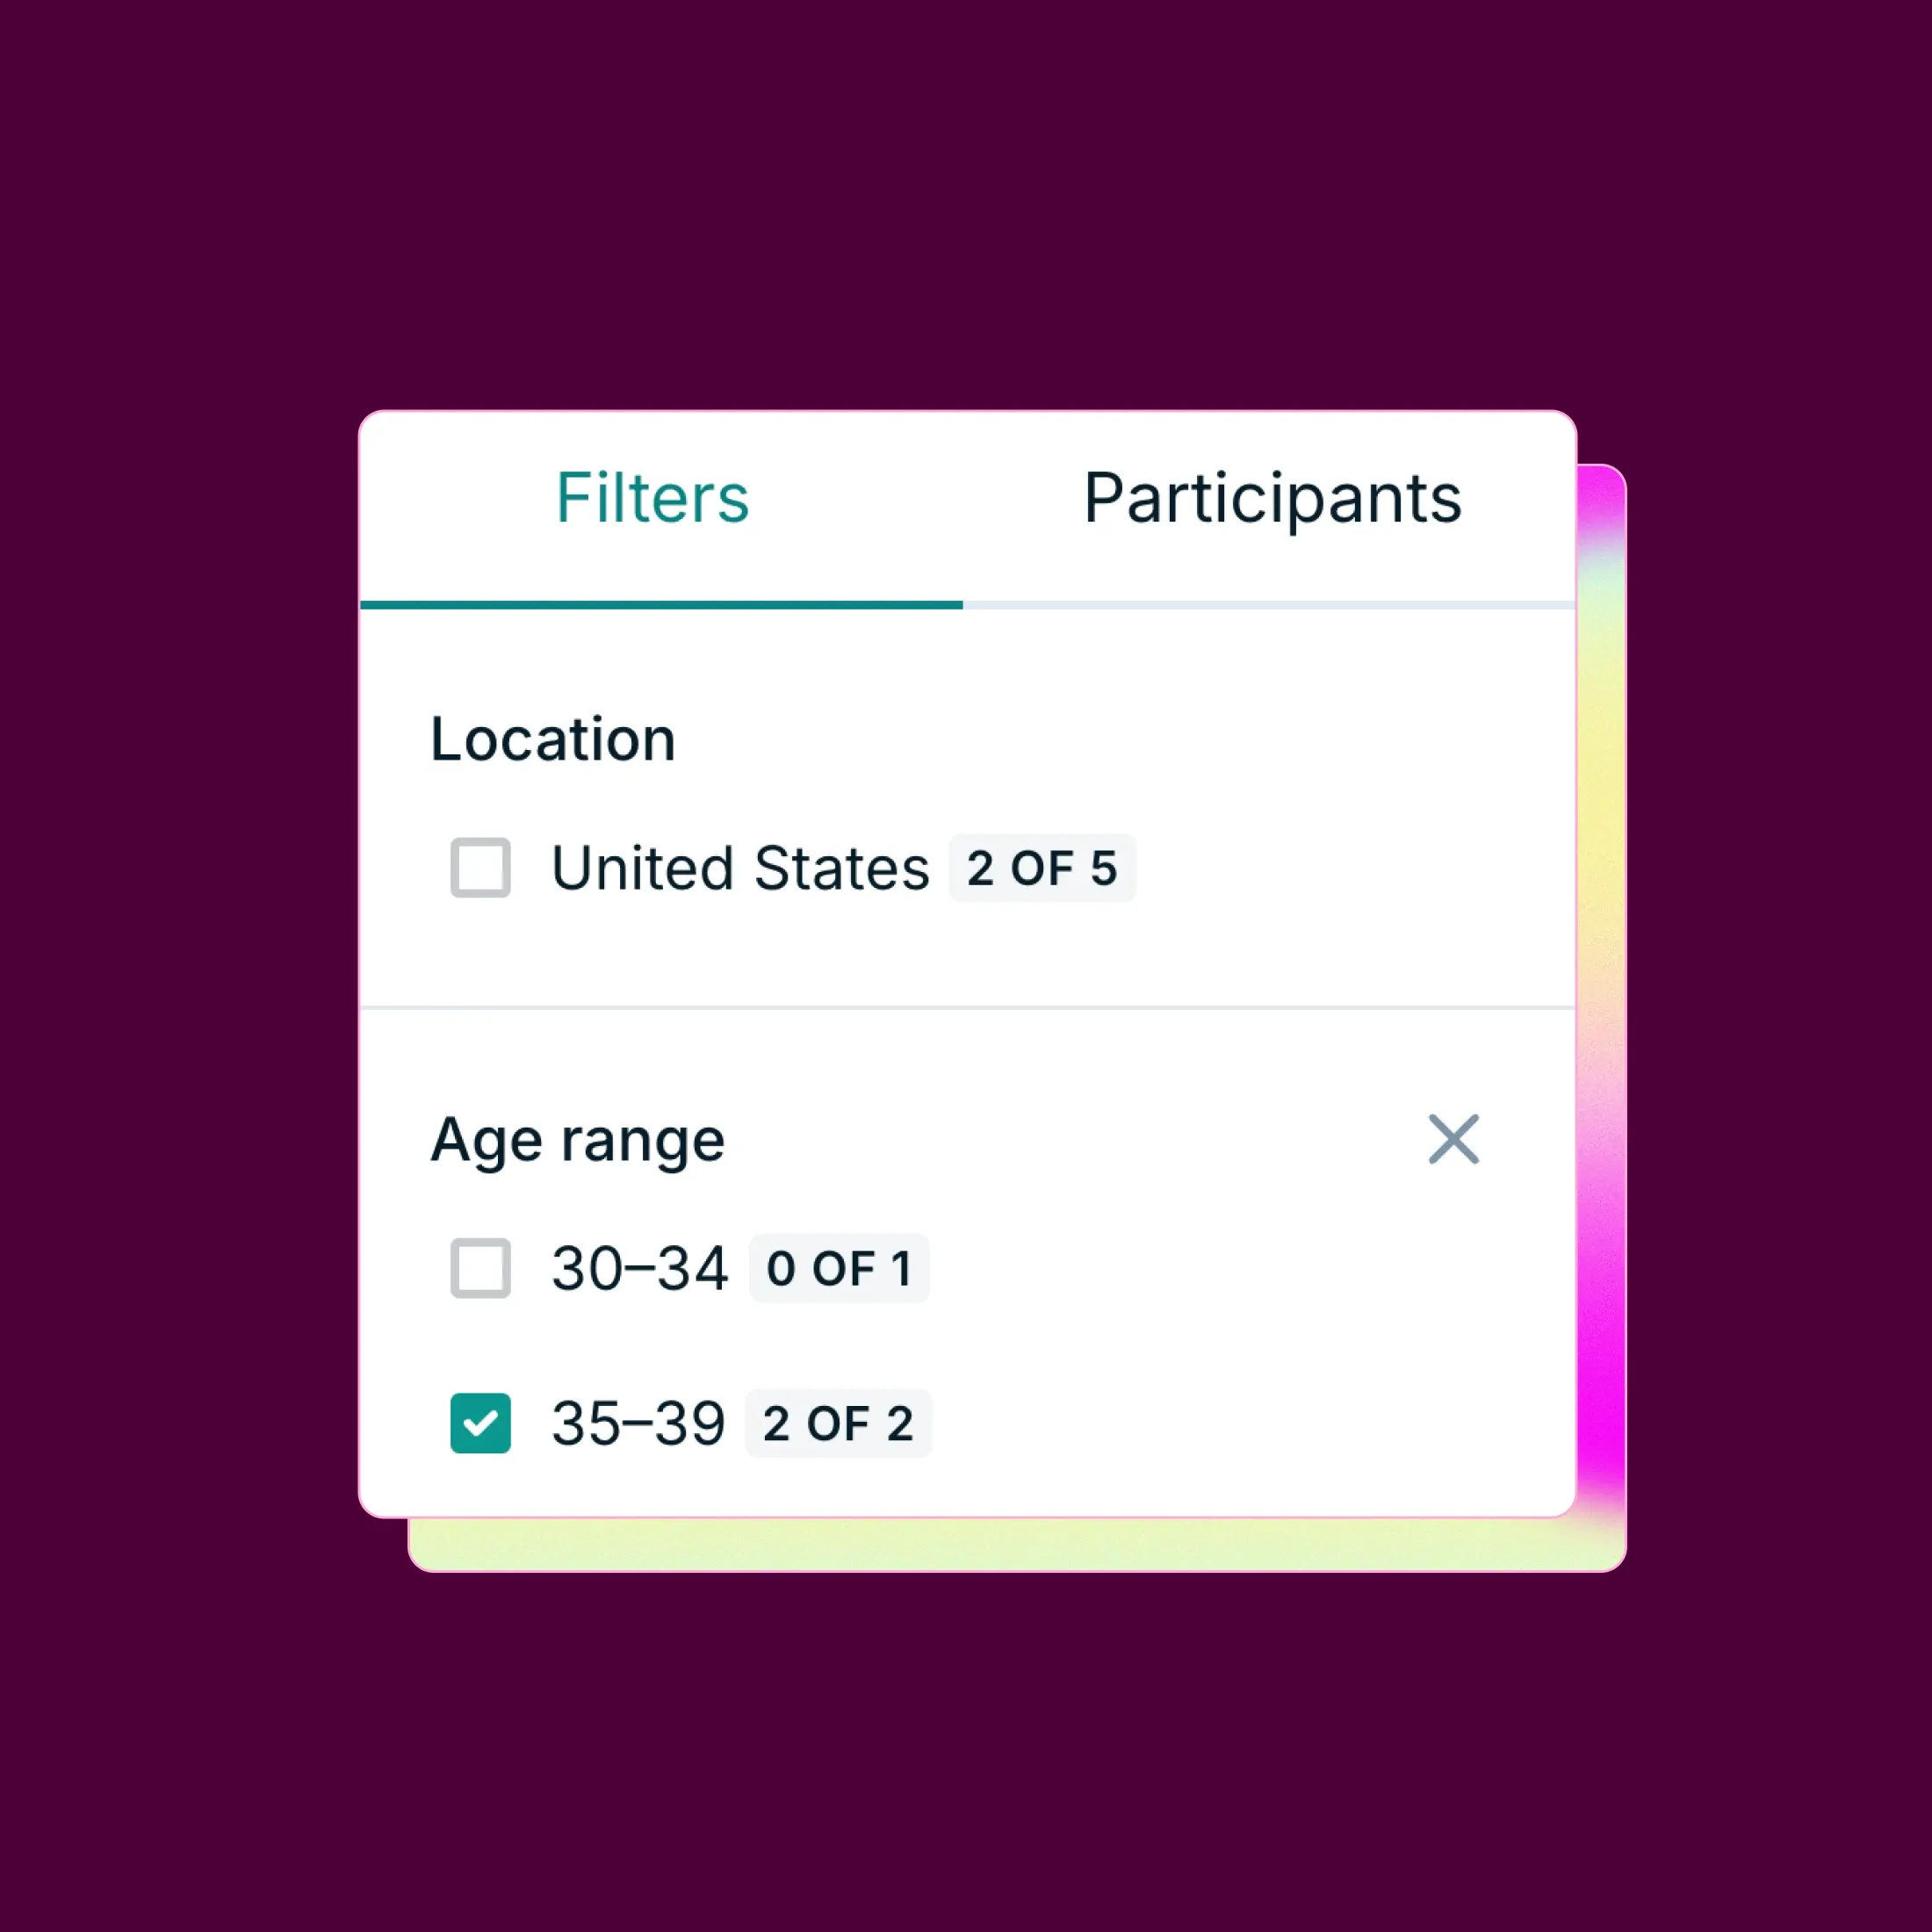
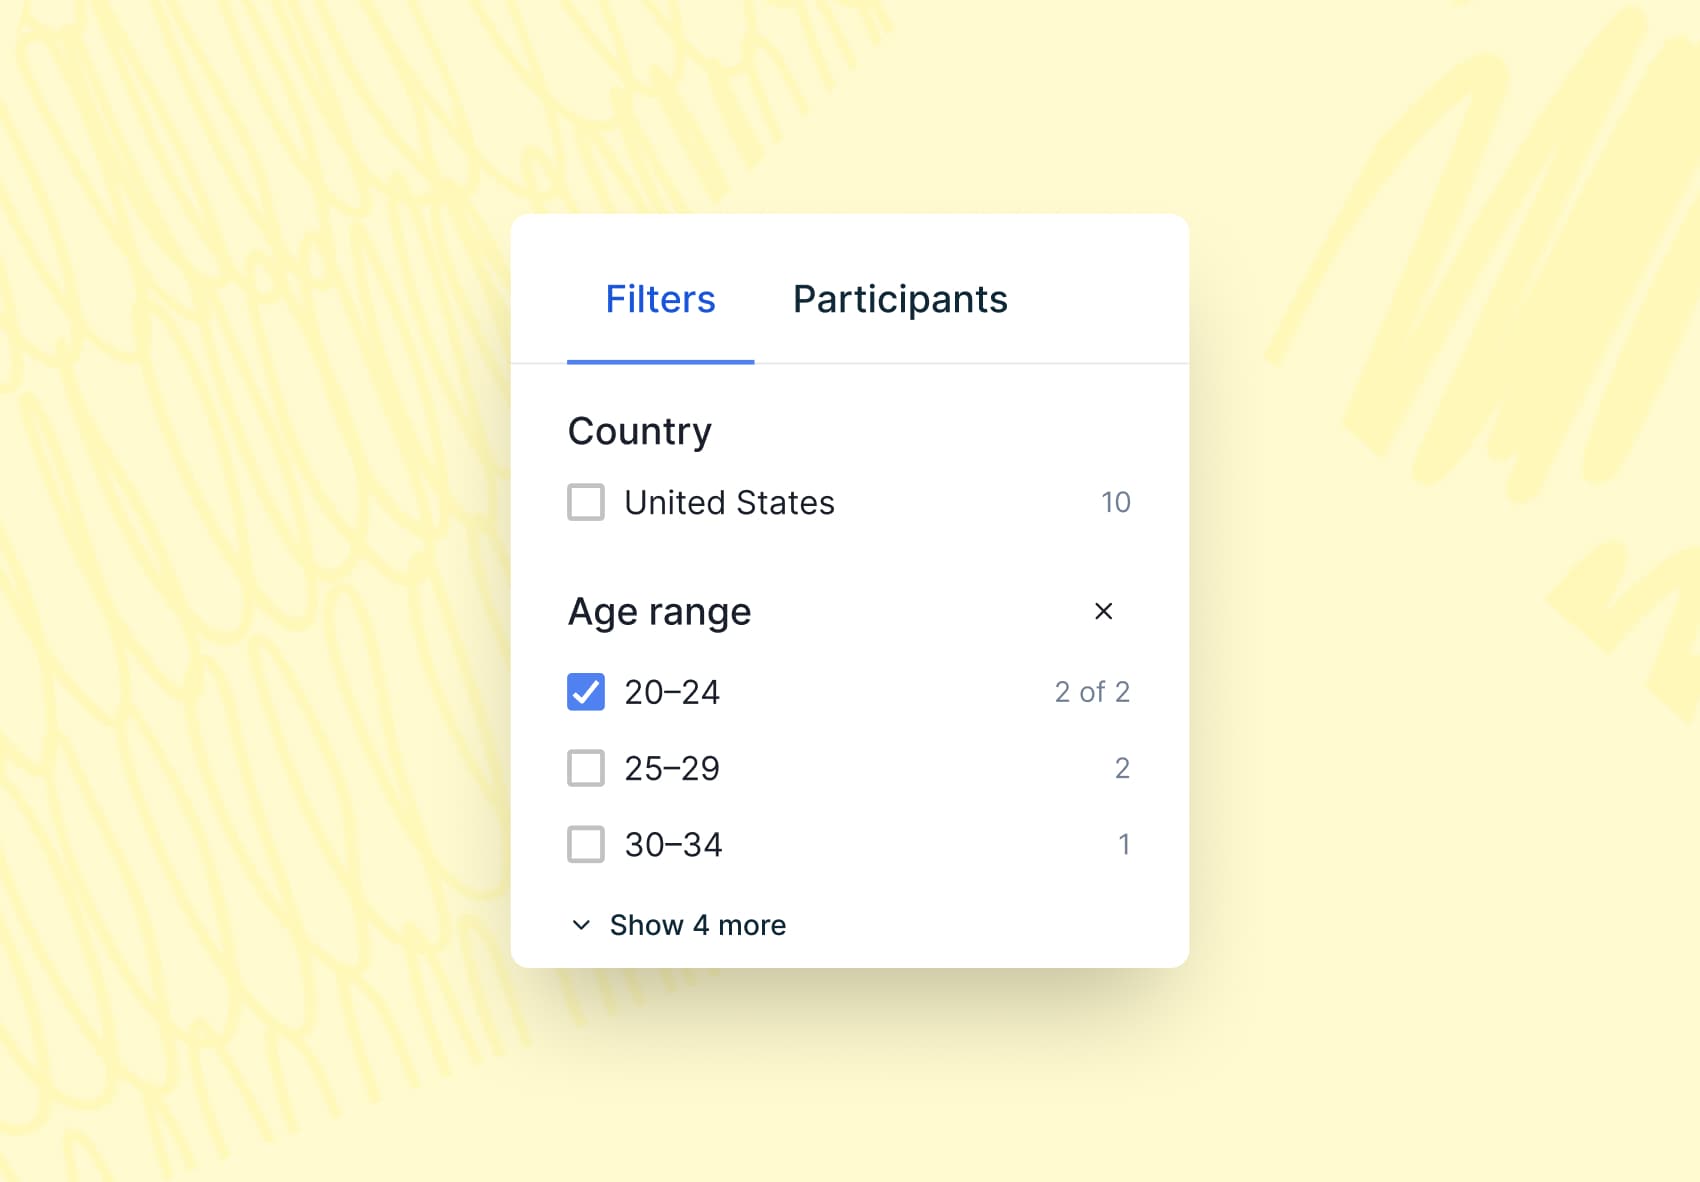
Filter for what matters
Cut the noise to quickly surface relevant insights by slicing your data across audiences, behaviors, and responses.
Filter by demographics, survey or question responses, and more
Combine filters to uncover patterns across specific segments
Zoom into individual participants or recruitment sources for deeper analysis
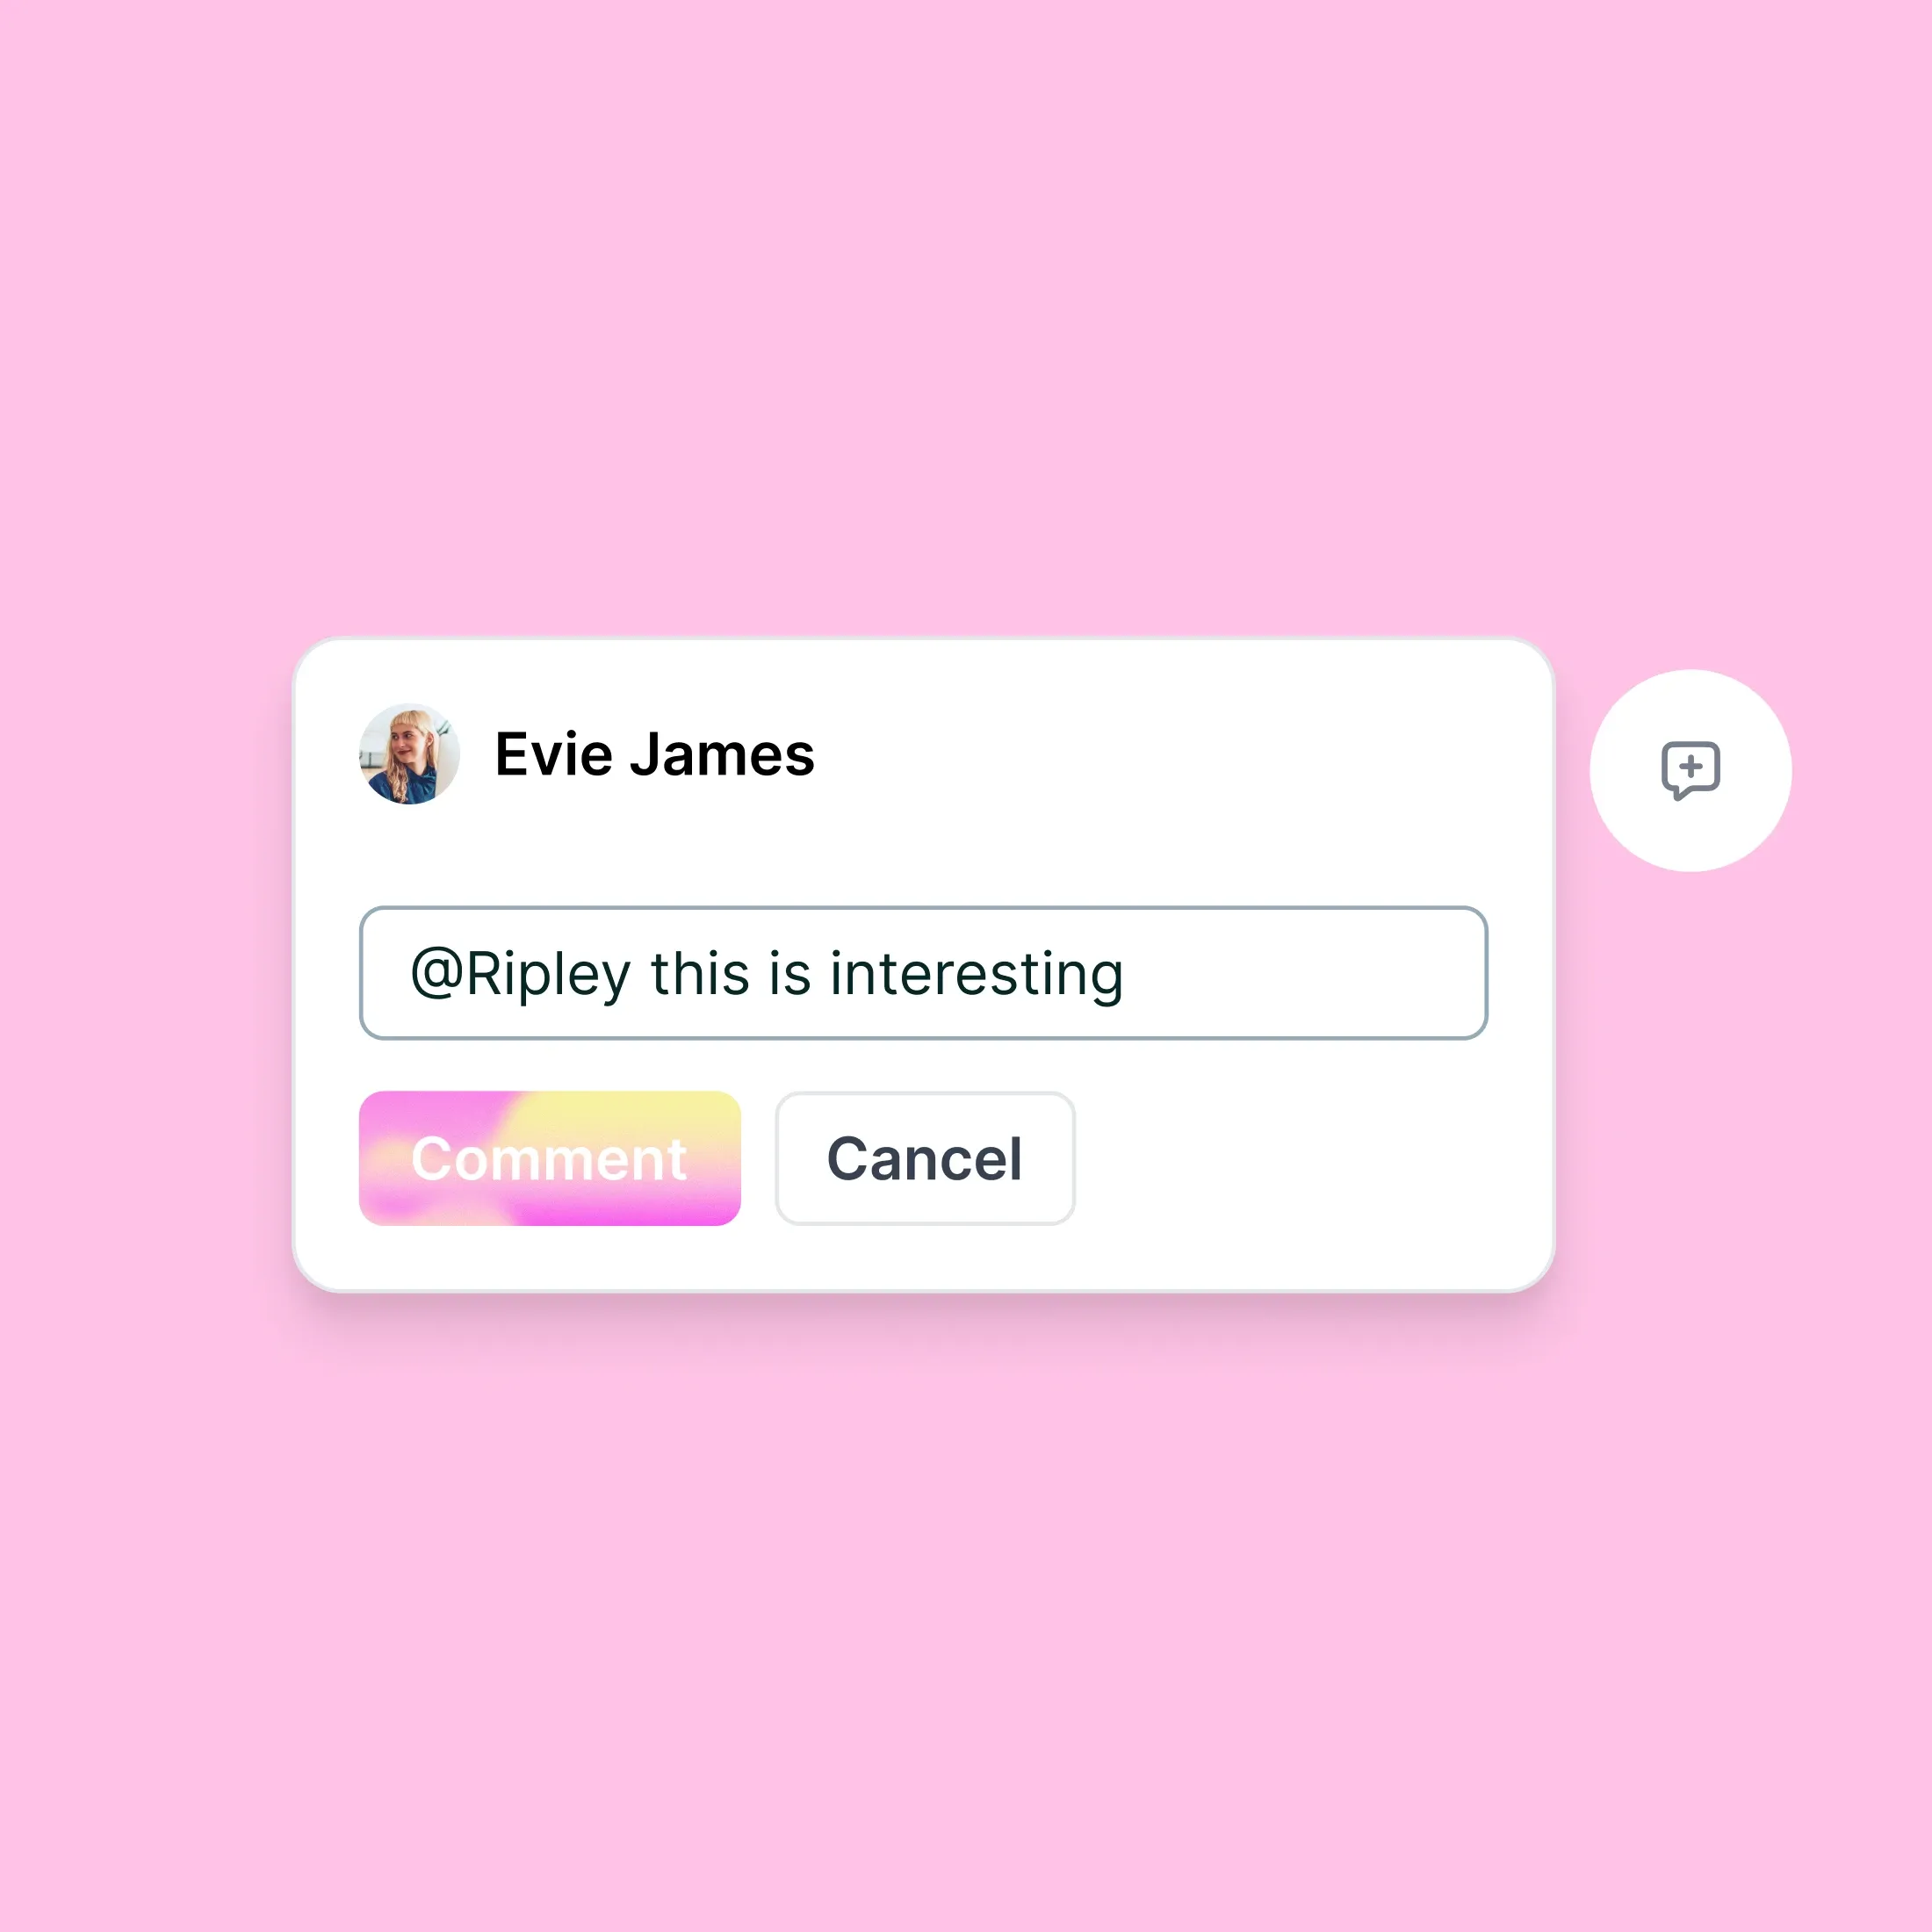
Collaborate with comments
Comment directly within your study builder and analysis view.
Highlight findings for discussion
Capture thoughts while reviewing tests
Tag team members to bring them into the conversation
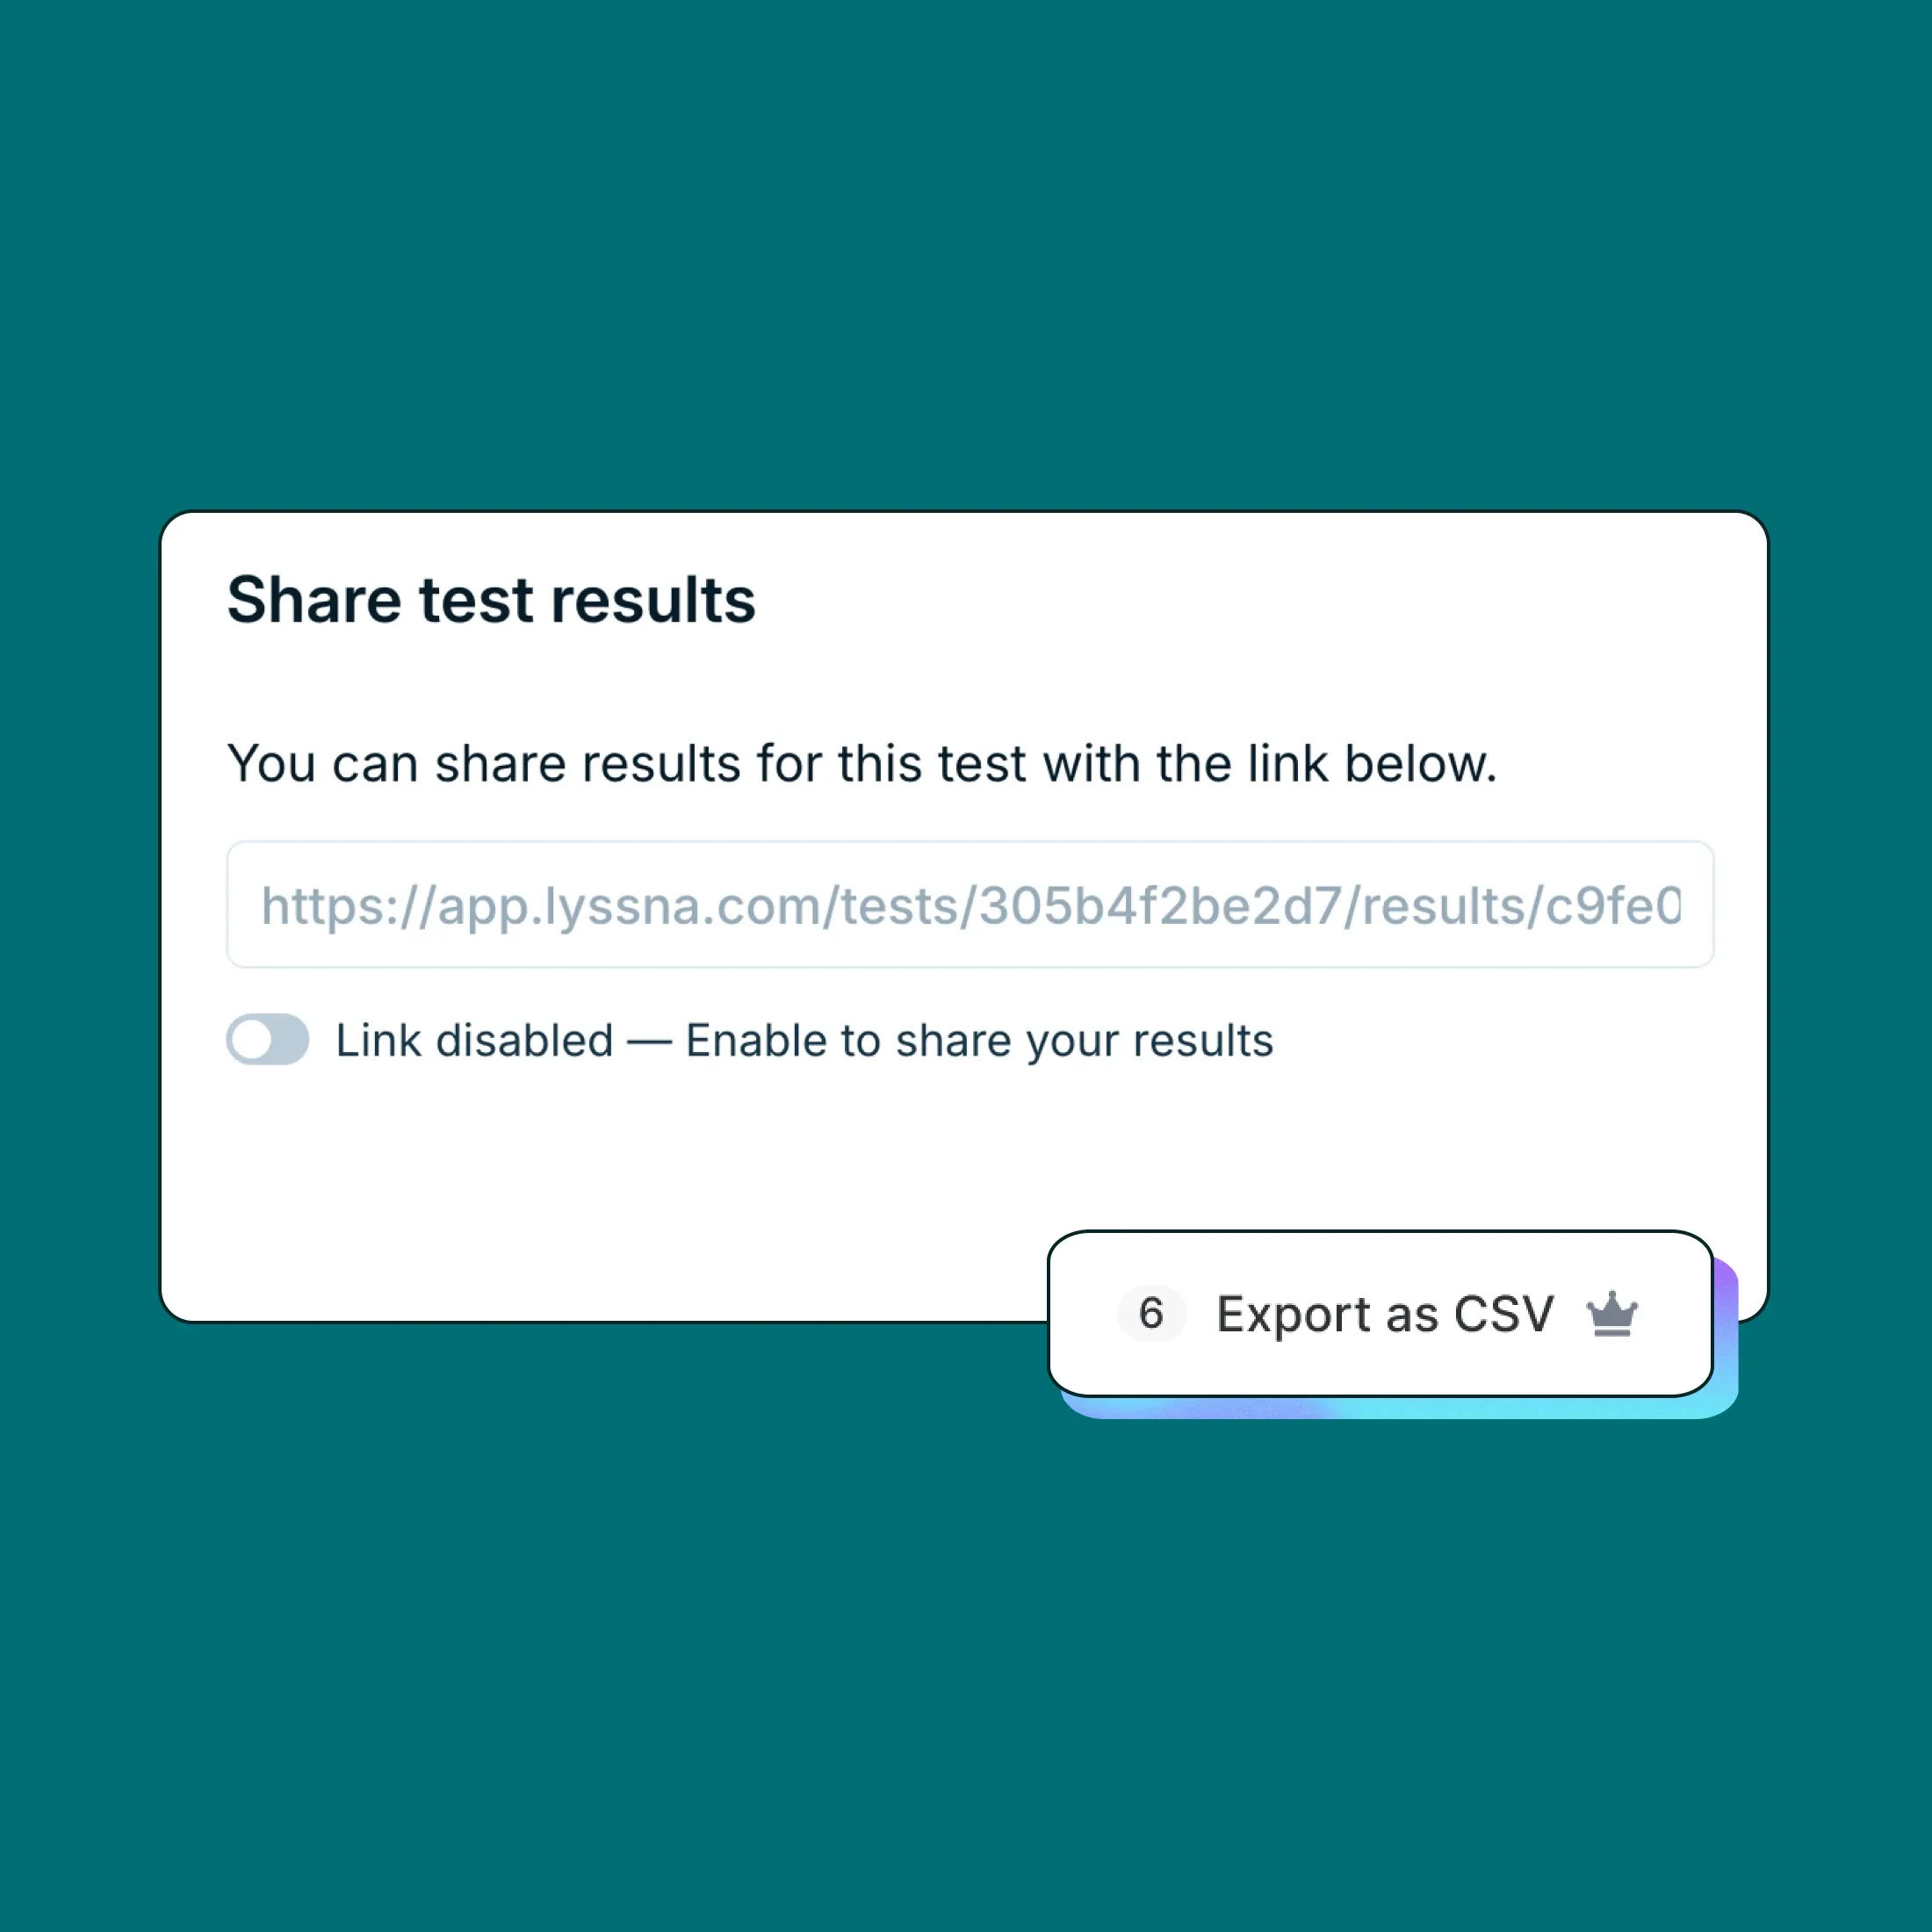
Export and share results
Download your data for deeper analysis, or share insights instantly with your team.
CSV exports for sorting, filtering, and advanced analysis in tools like Excel or Sheets
Sharelinks for easy, read-only access to test results—no login required
Visual exports (coming soon) to generate polished charts for presentations, decks, or Figma
Reports that match your method
Whether you’re running a survey, preference test, tree test, or any another method, Lyssna delivers comprehensive reports with the granular detail you need.
A visual summary showing how consistently participants chose the same responses, helping you quickly spot areas of strong consensus or disagreement.
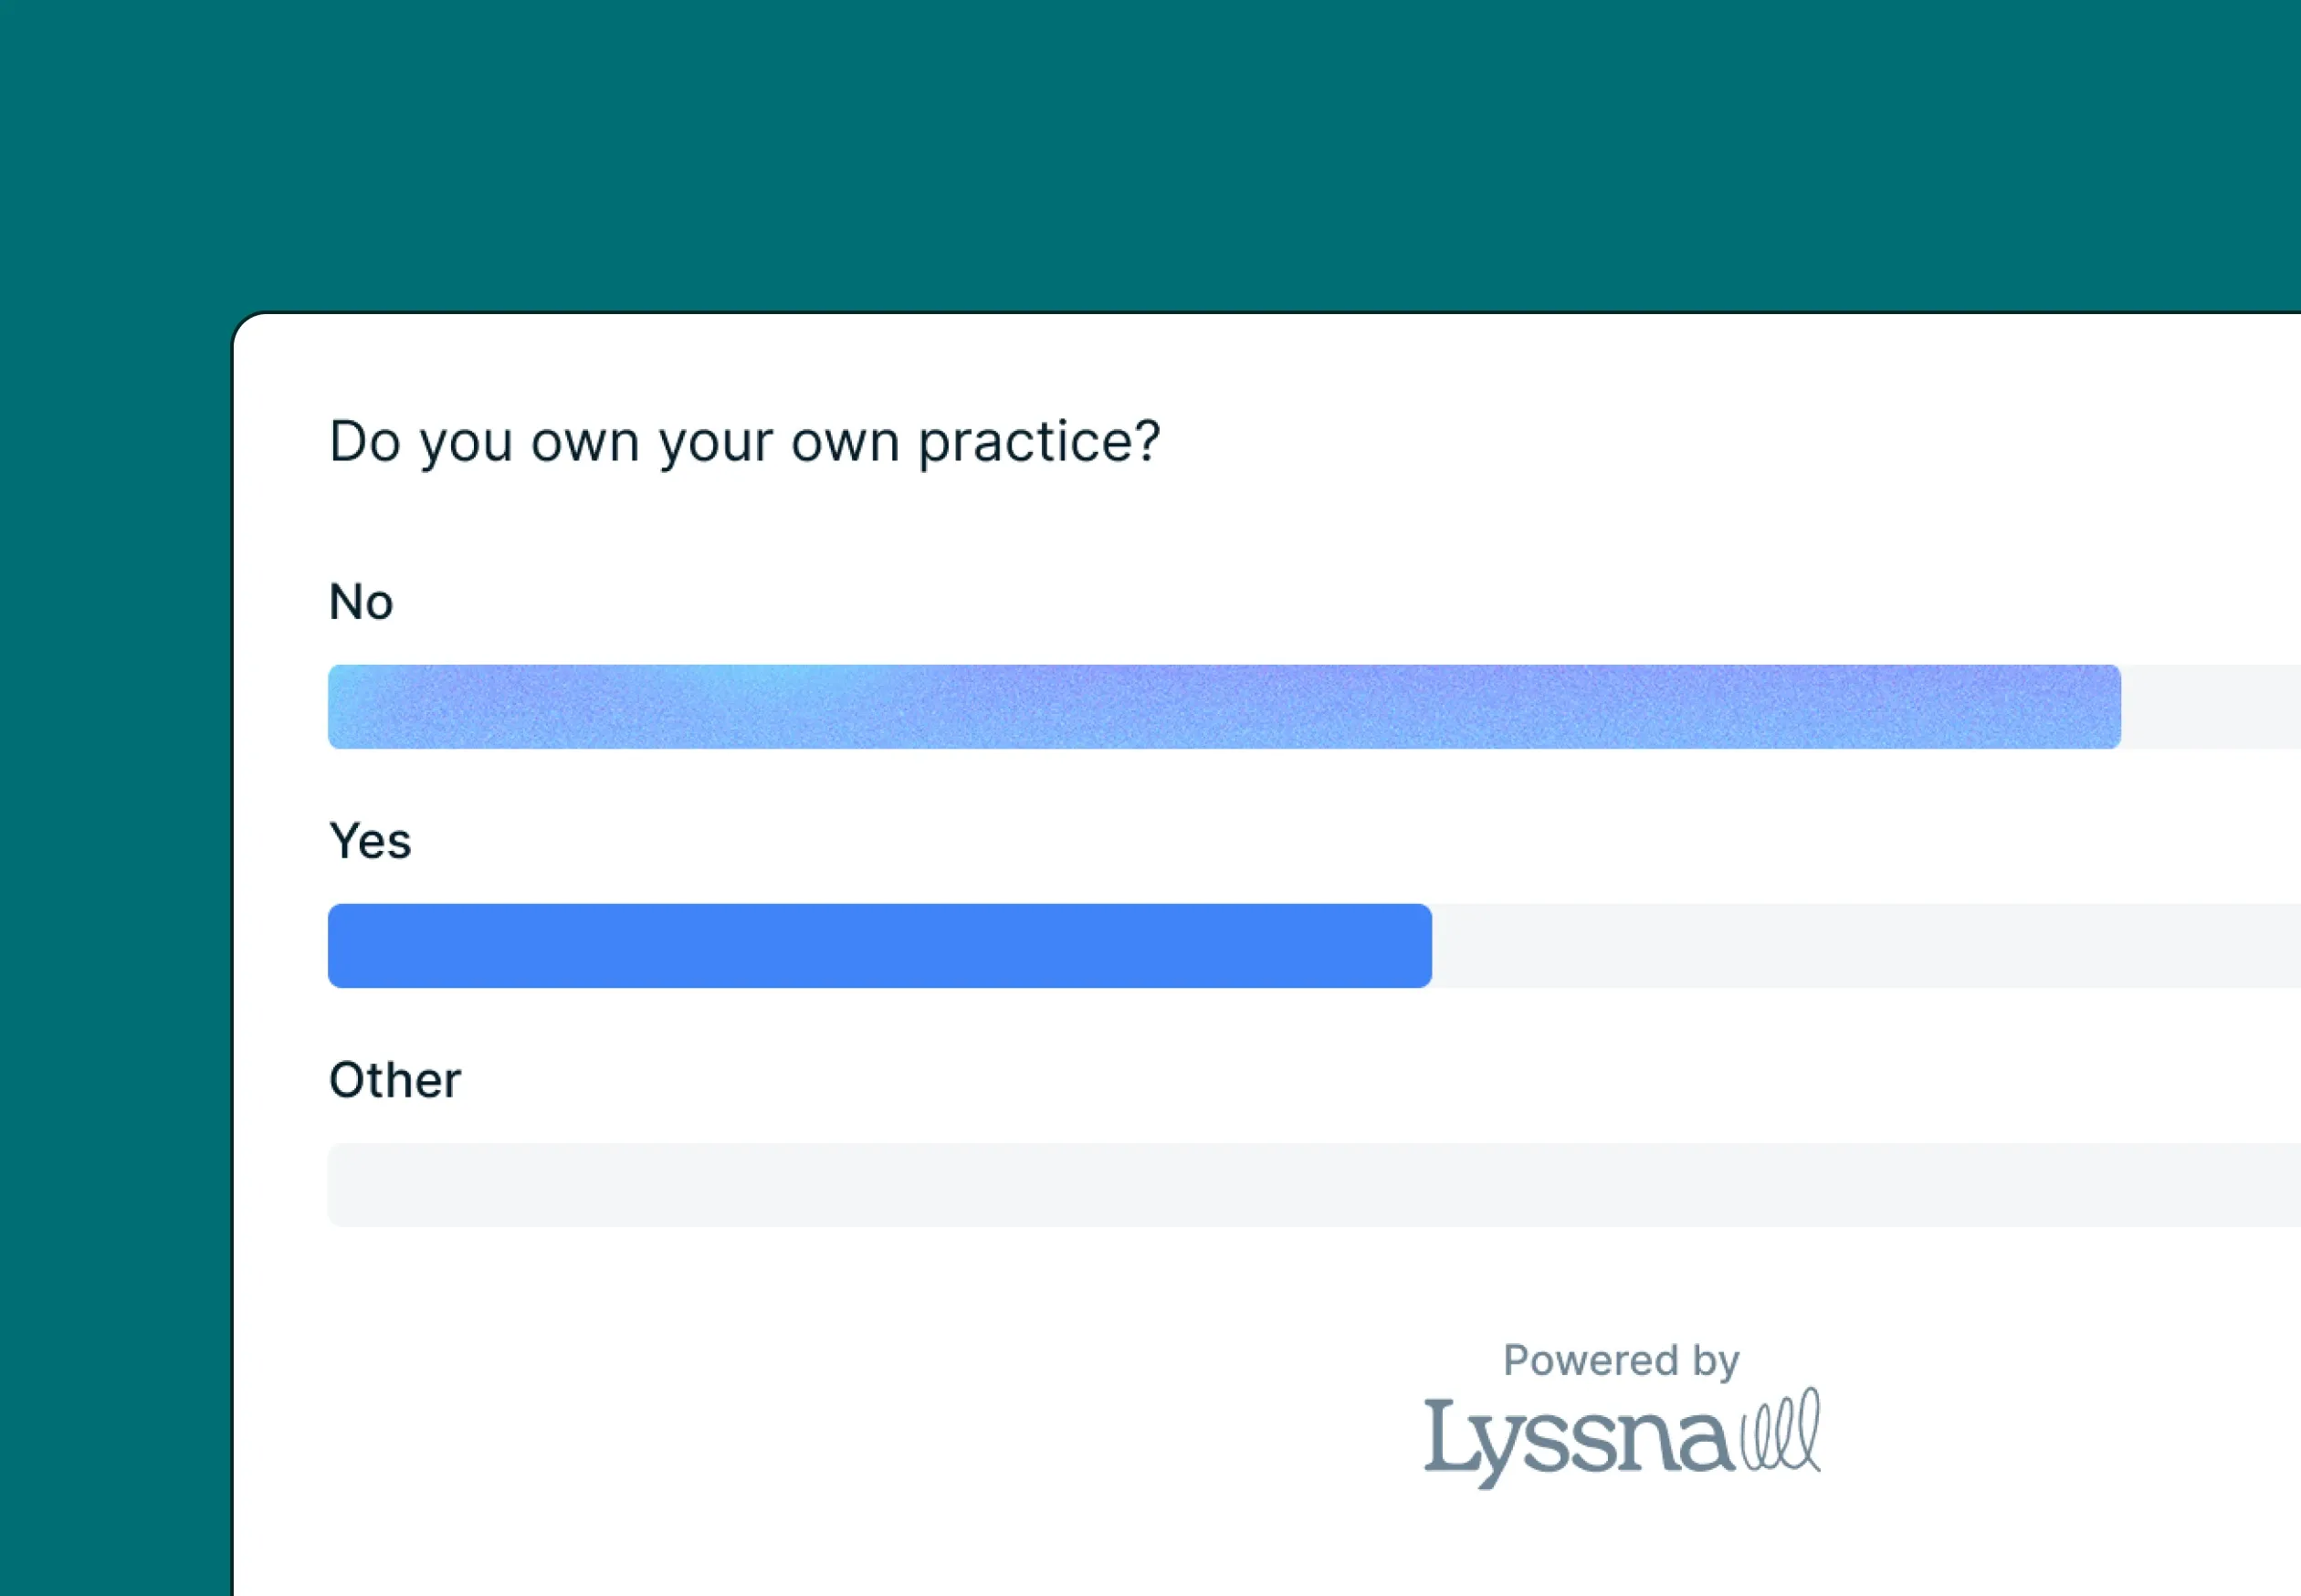
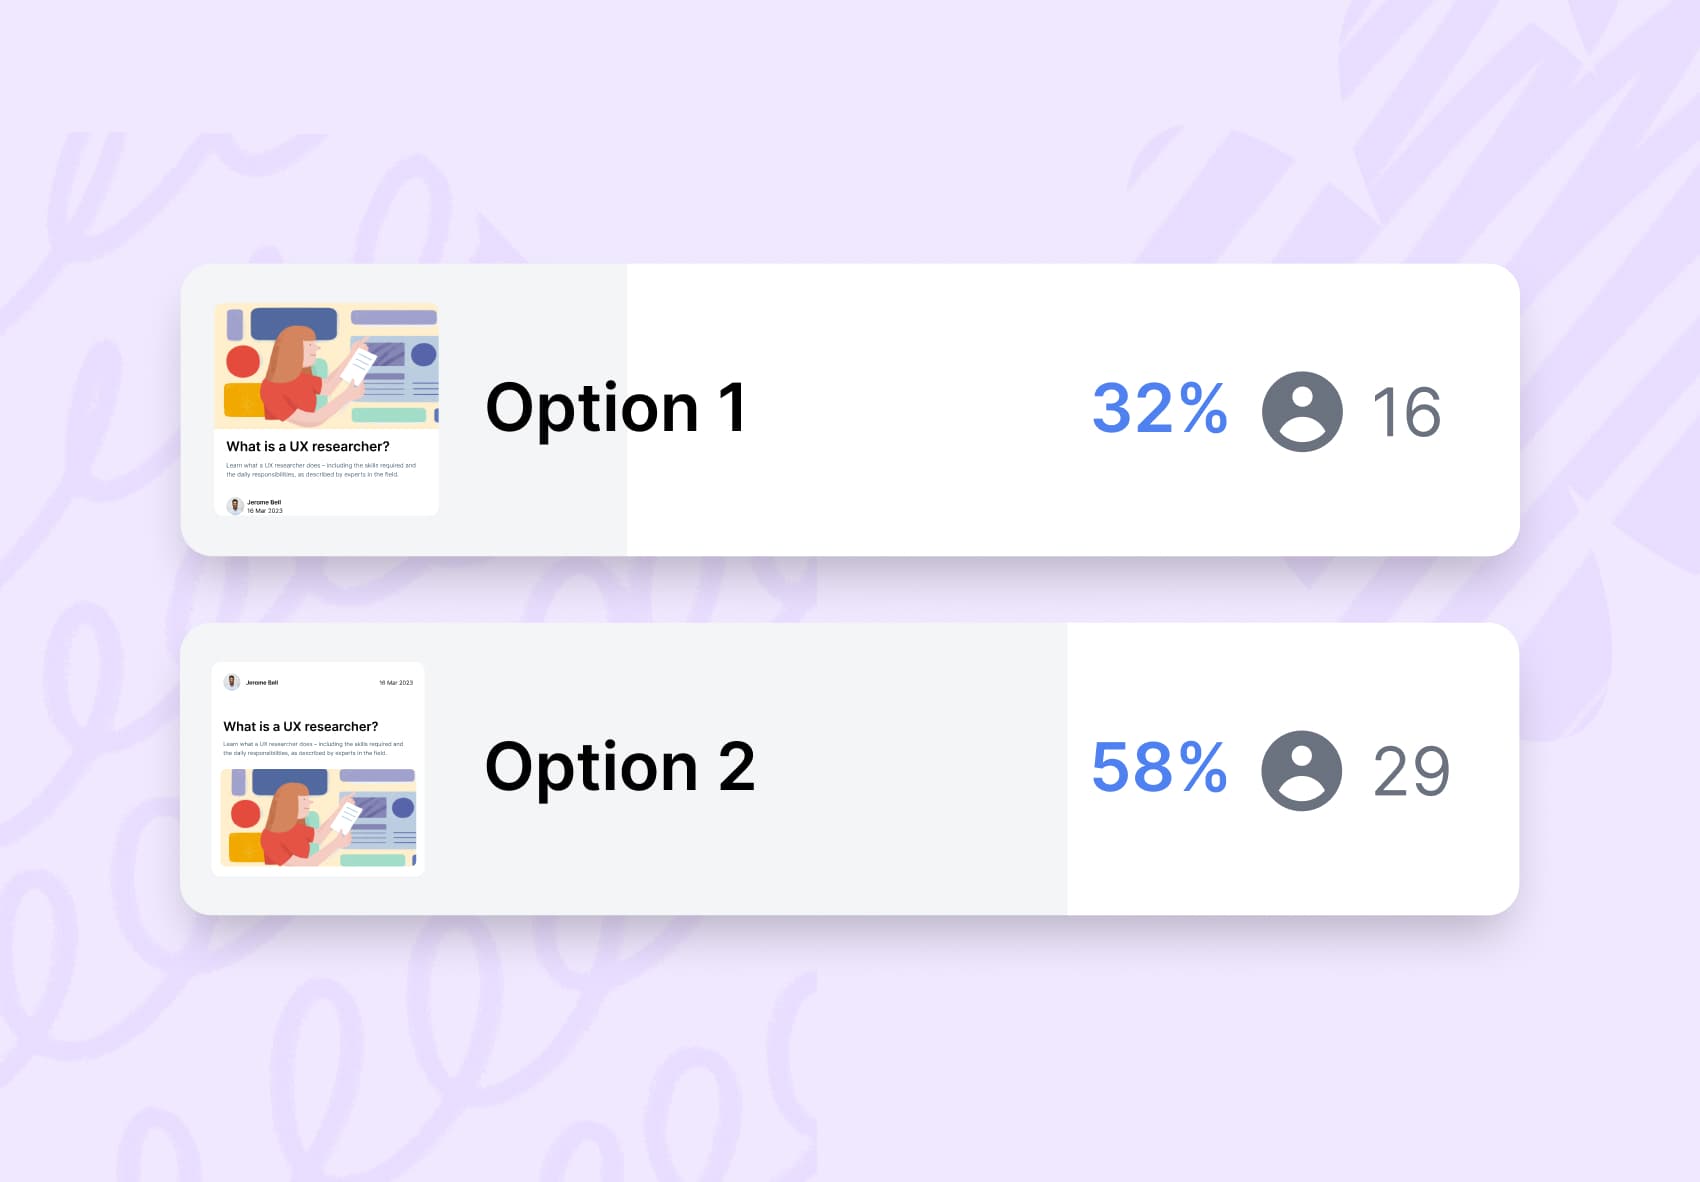
Visually see participant choices—when relevant alongside images—making it easy to compare preferences and identify top selections at a glance.

See where participants clicked on an image or interface, helping you quickly spot attention hotspots and interaction patterns.
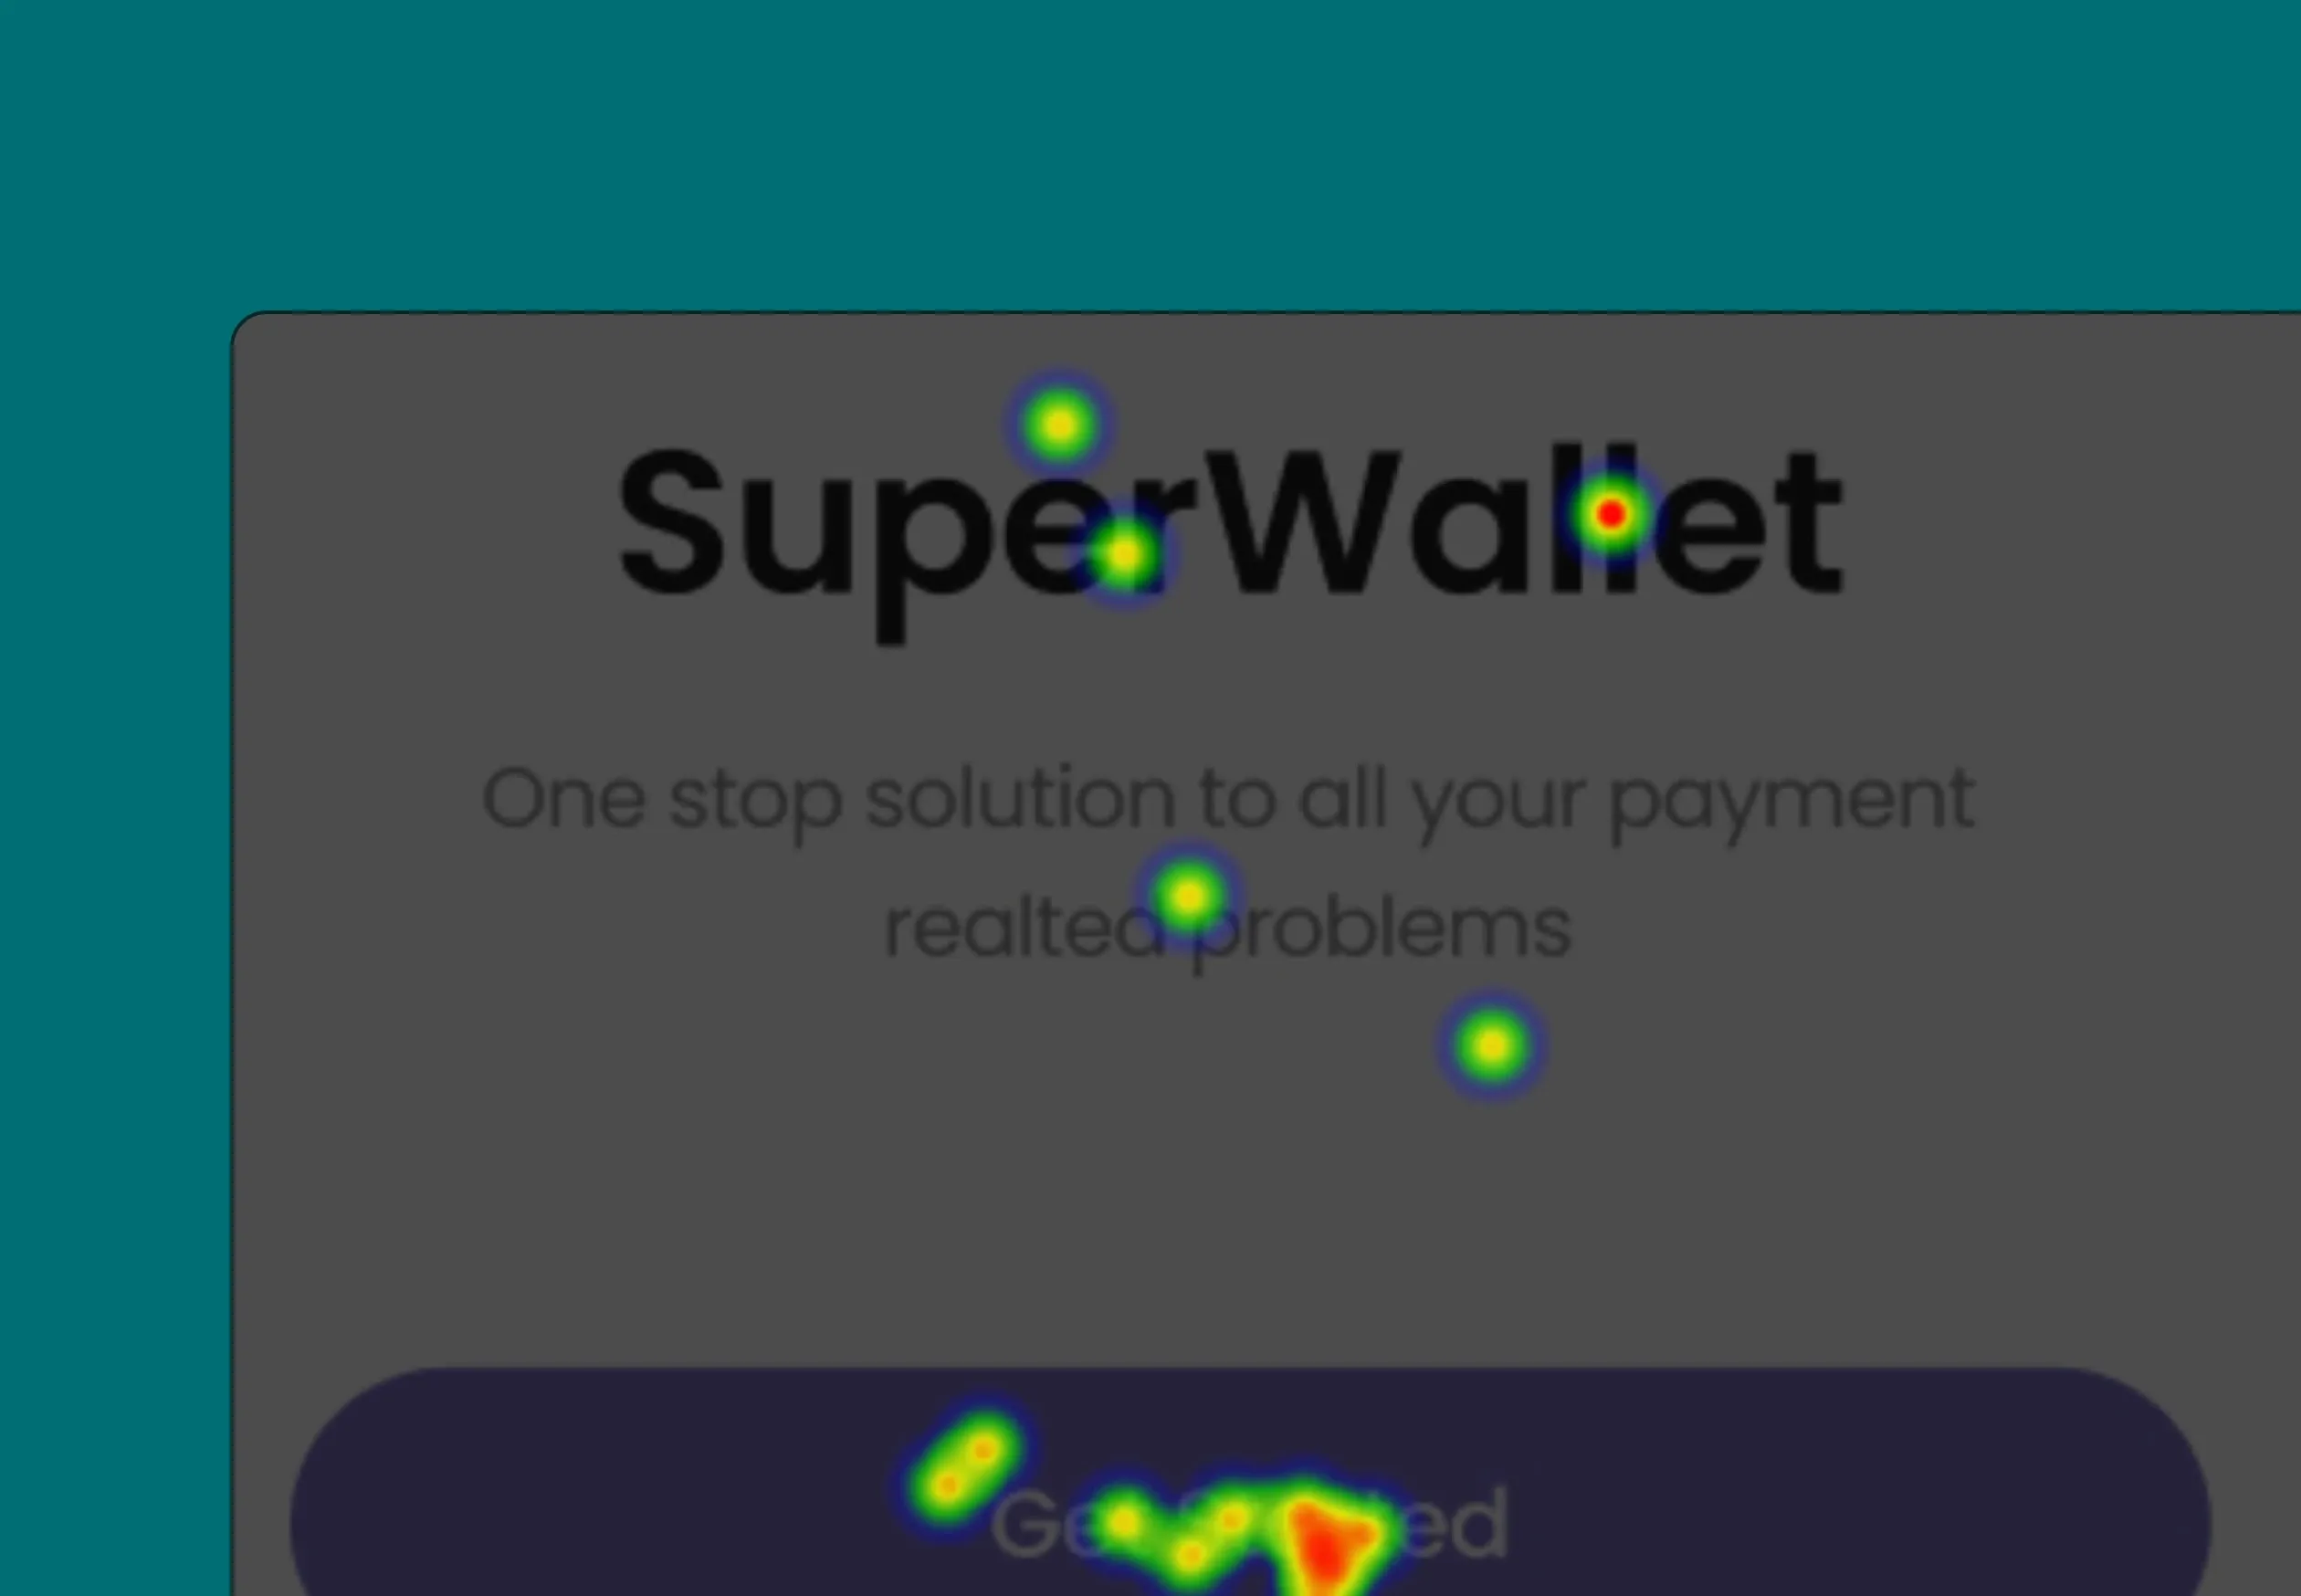
Highlights where participants focused or clicked most, using color intensity to reveal patterns of attention and engagement.
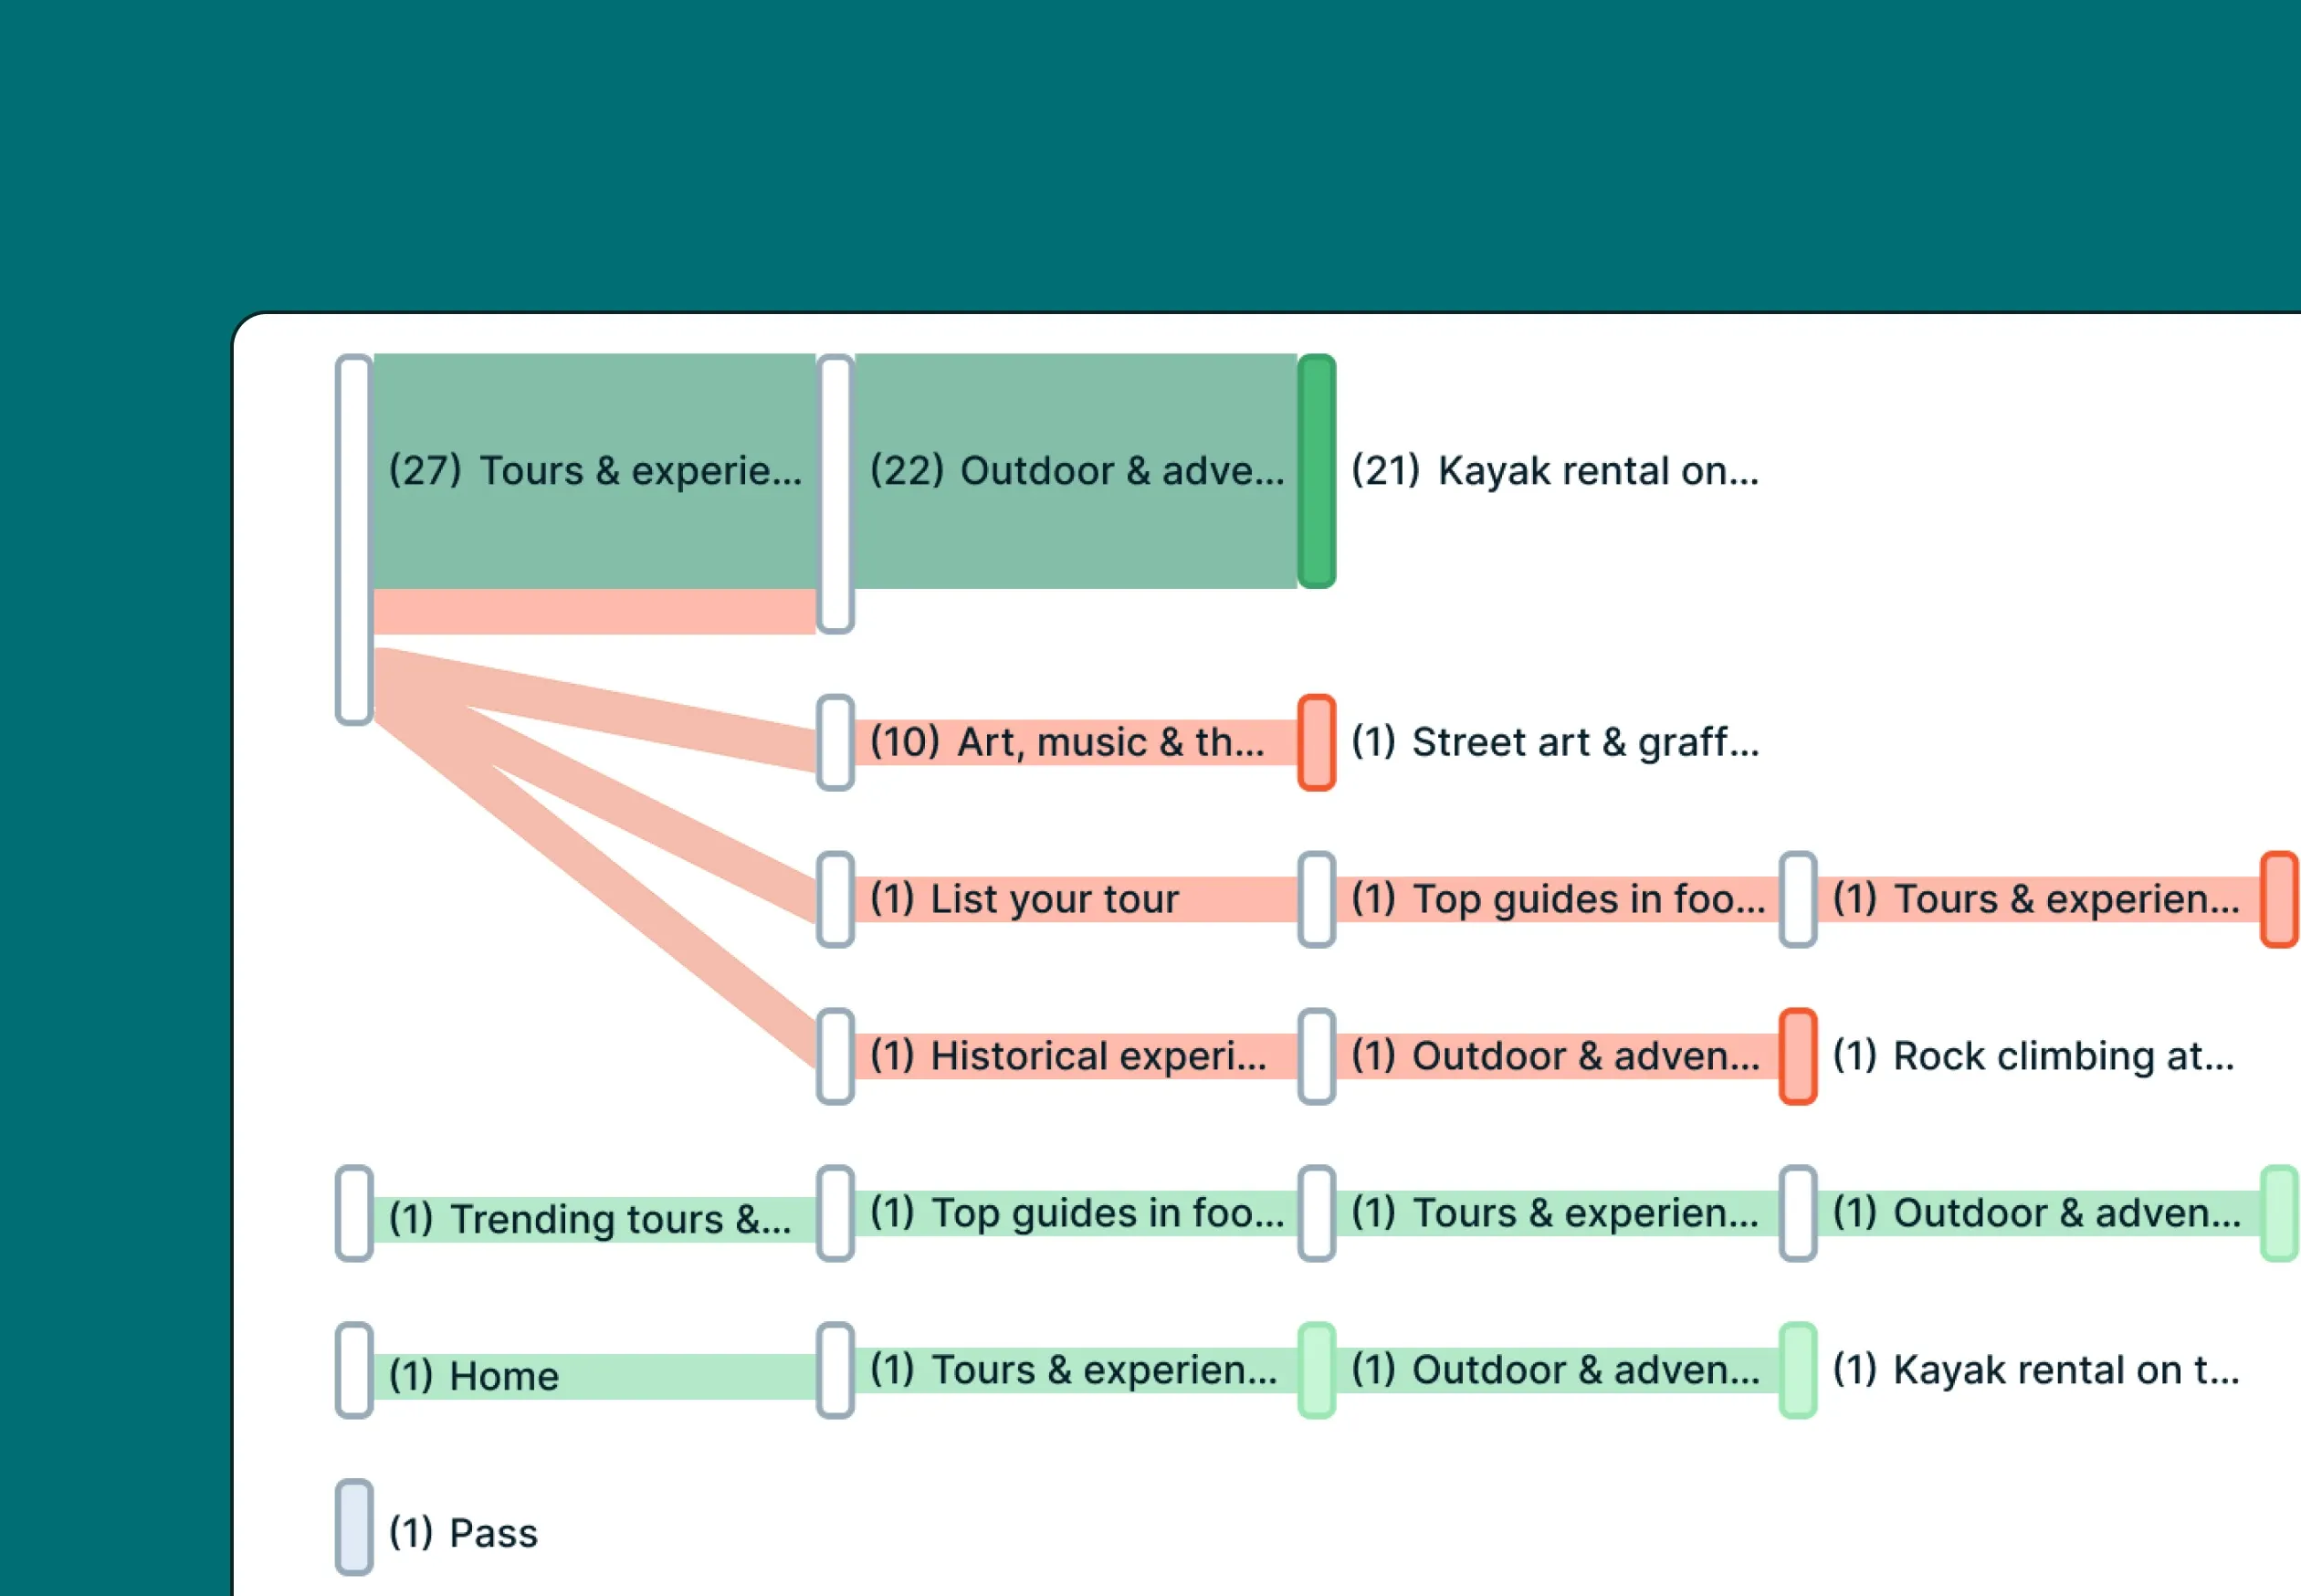
Visualize the flow of responses or choices between steps, making it easy to see how participants move through a journey or change selections.
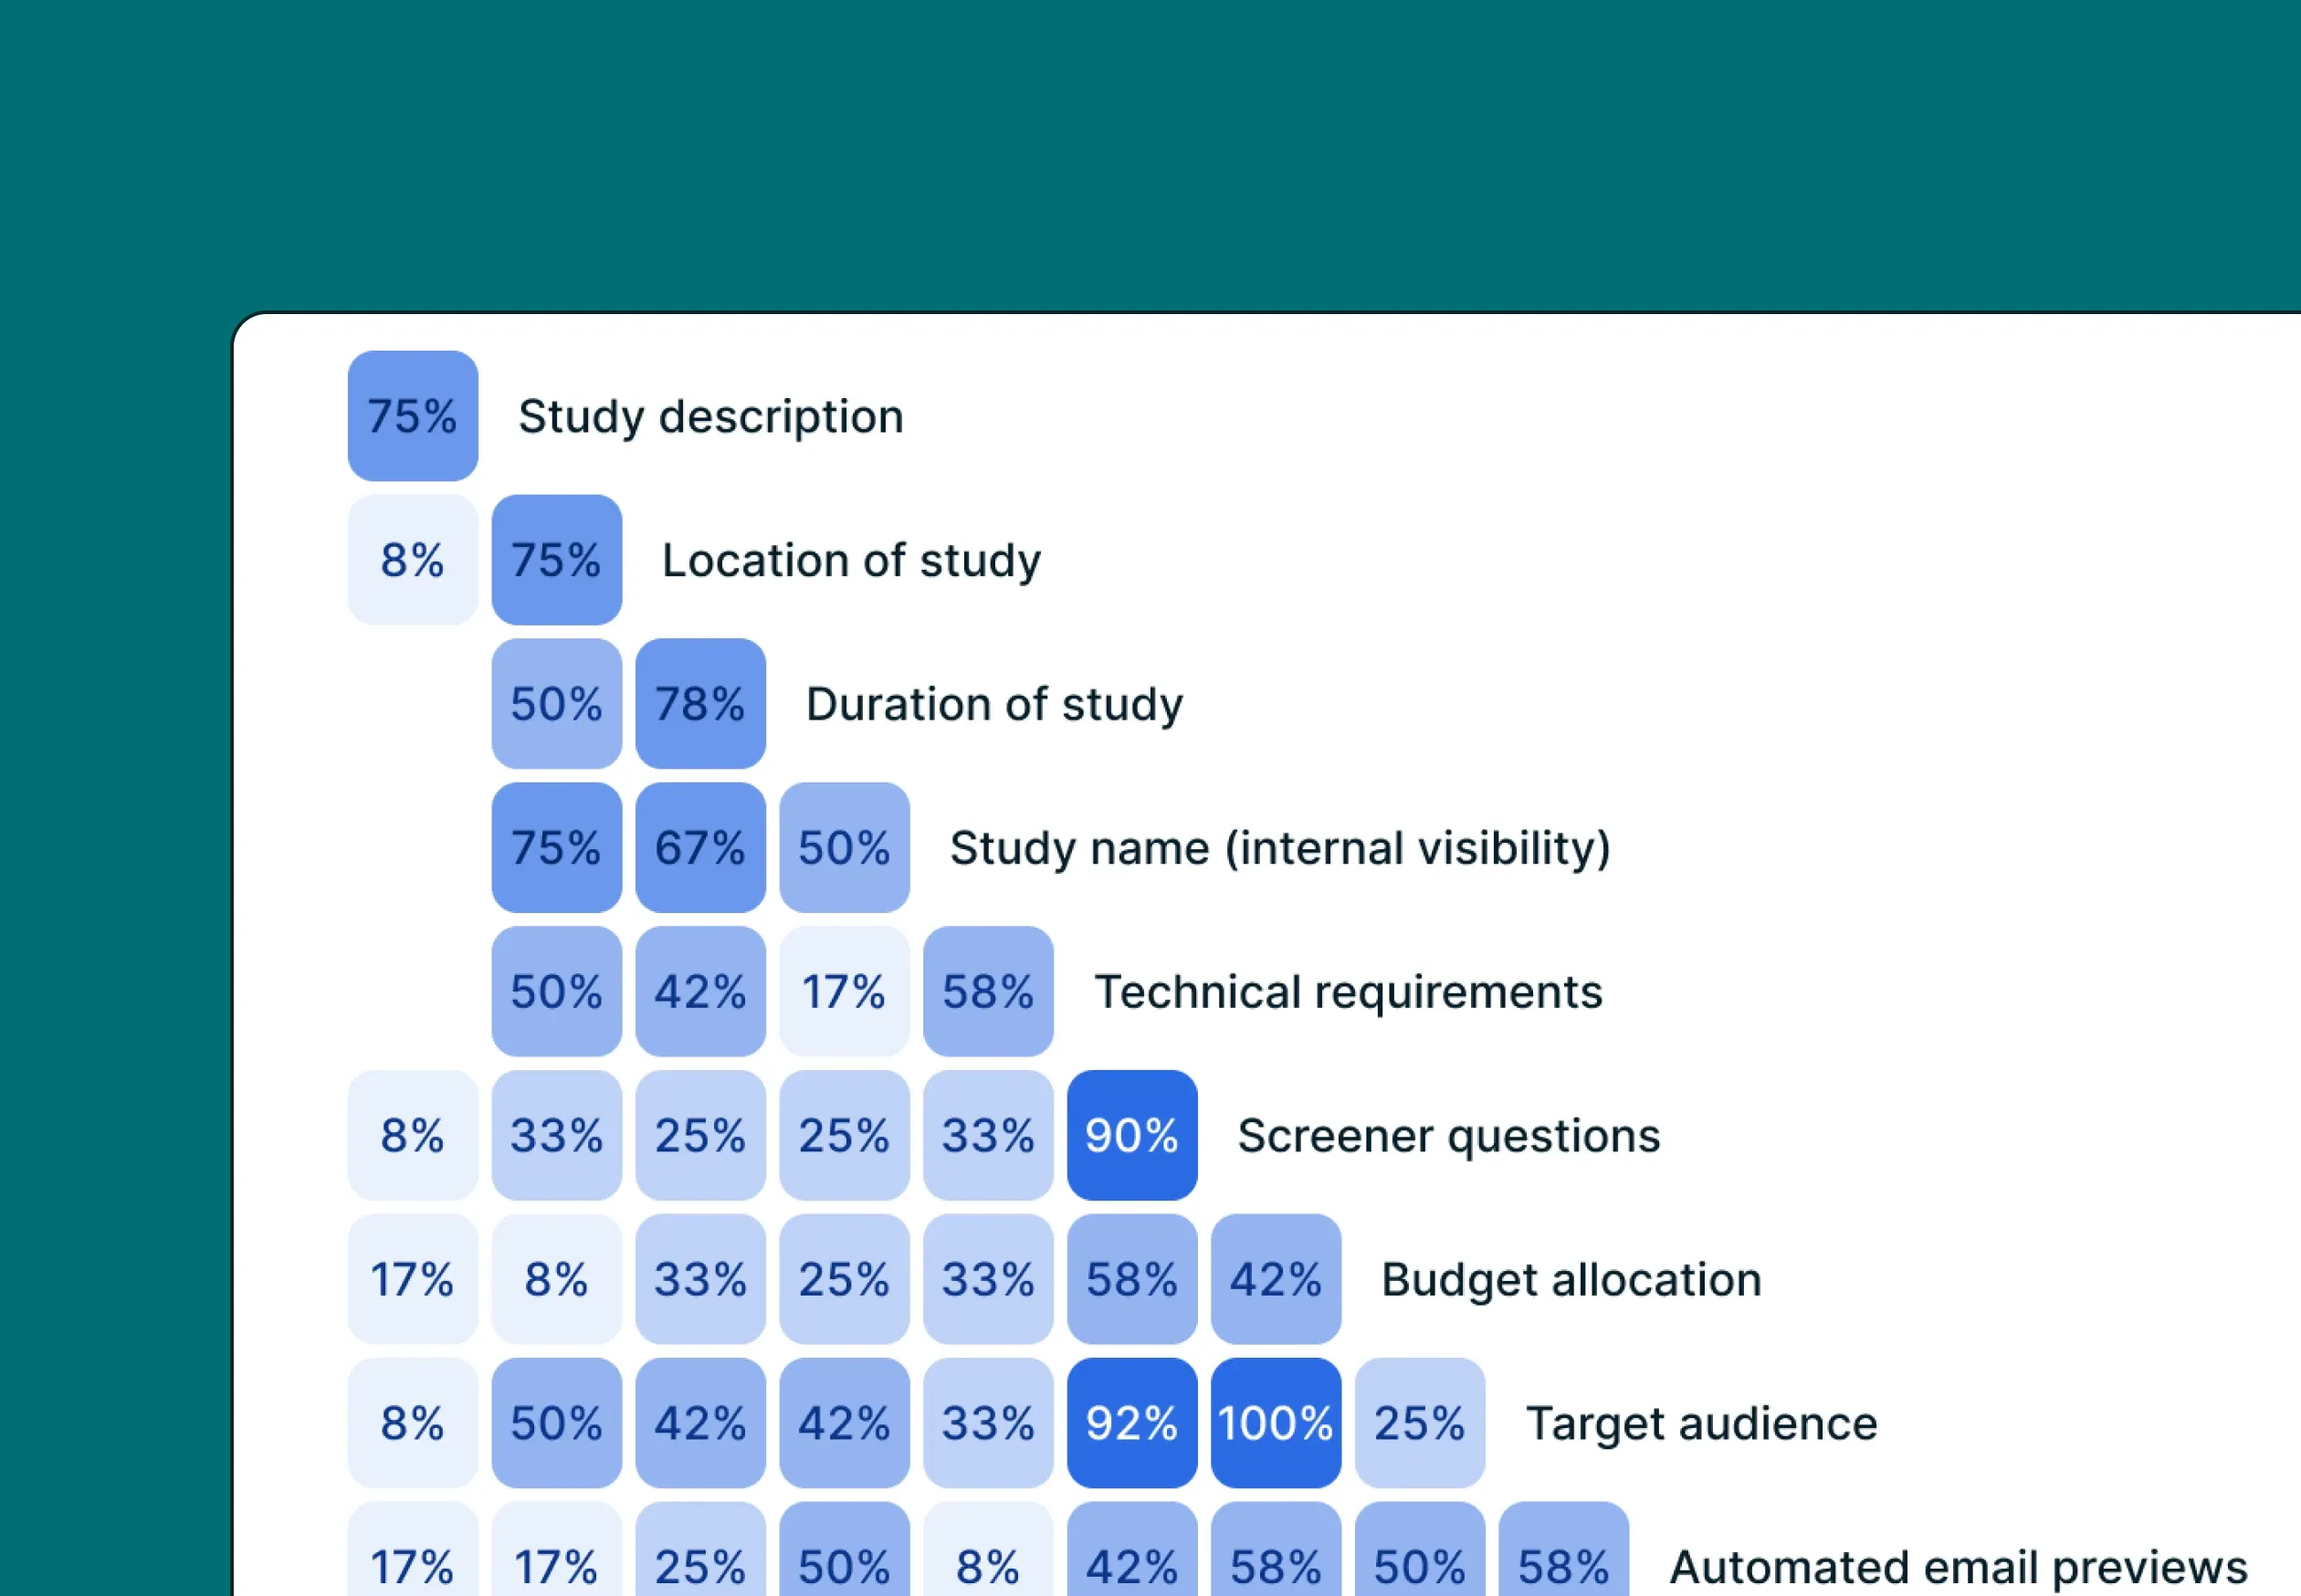
Displays how closely participants' responses align with one another, helping you identify patterns, clusters, or outliers in their choices.
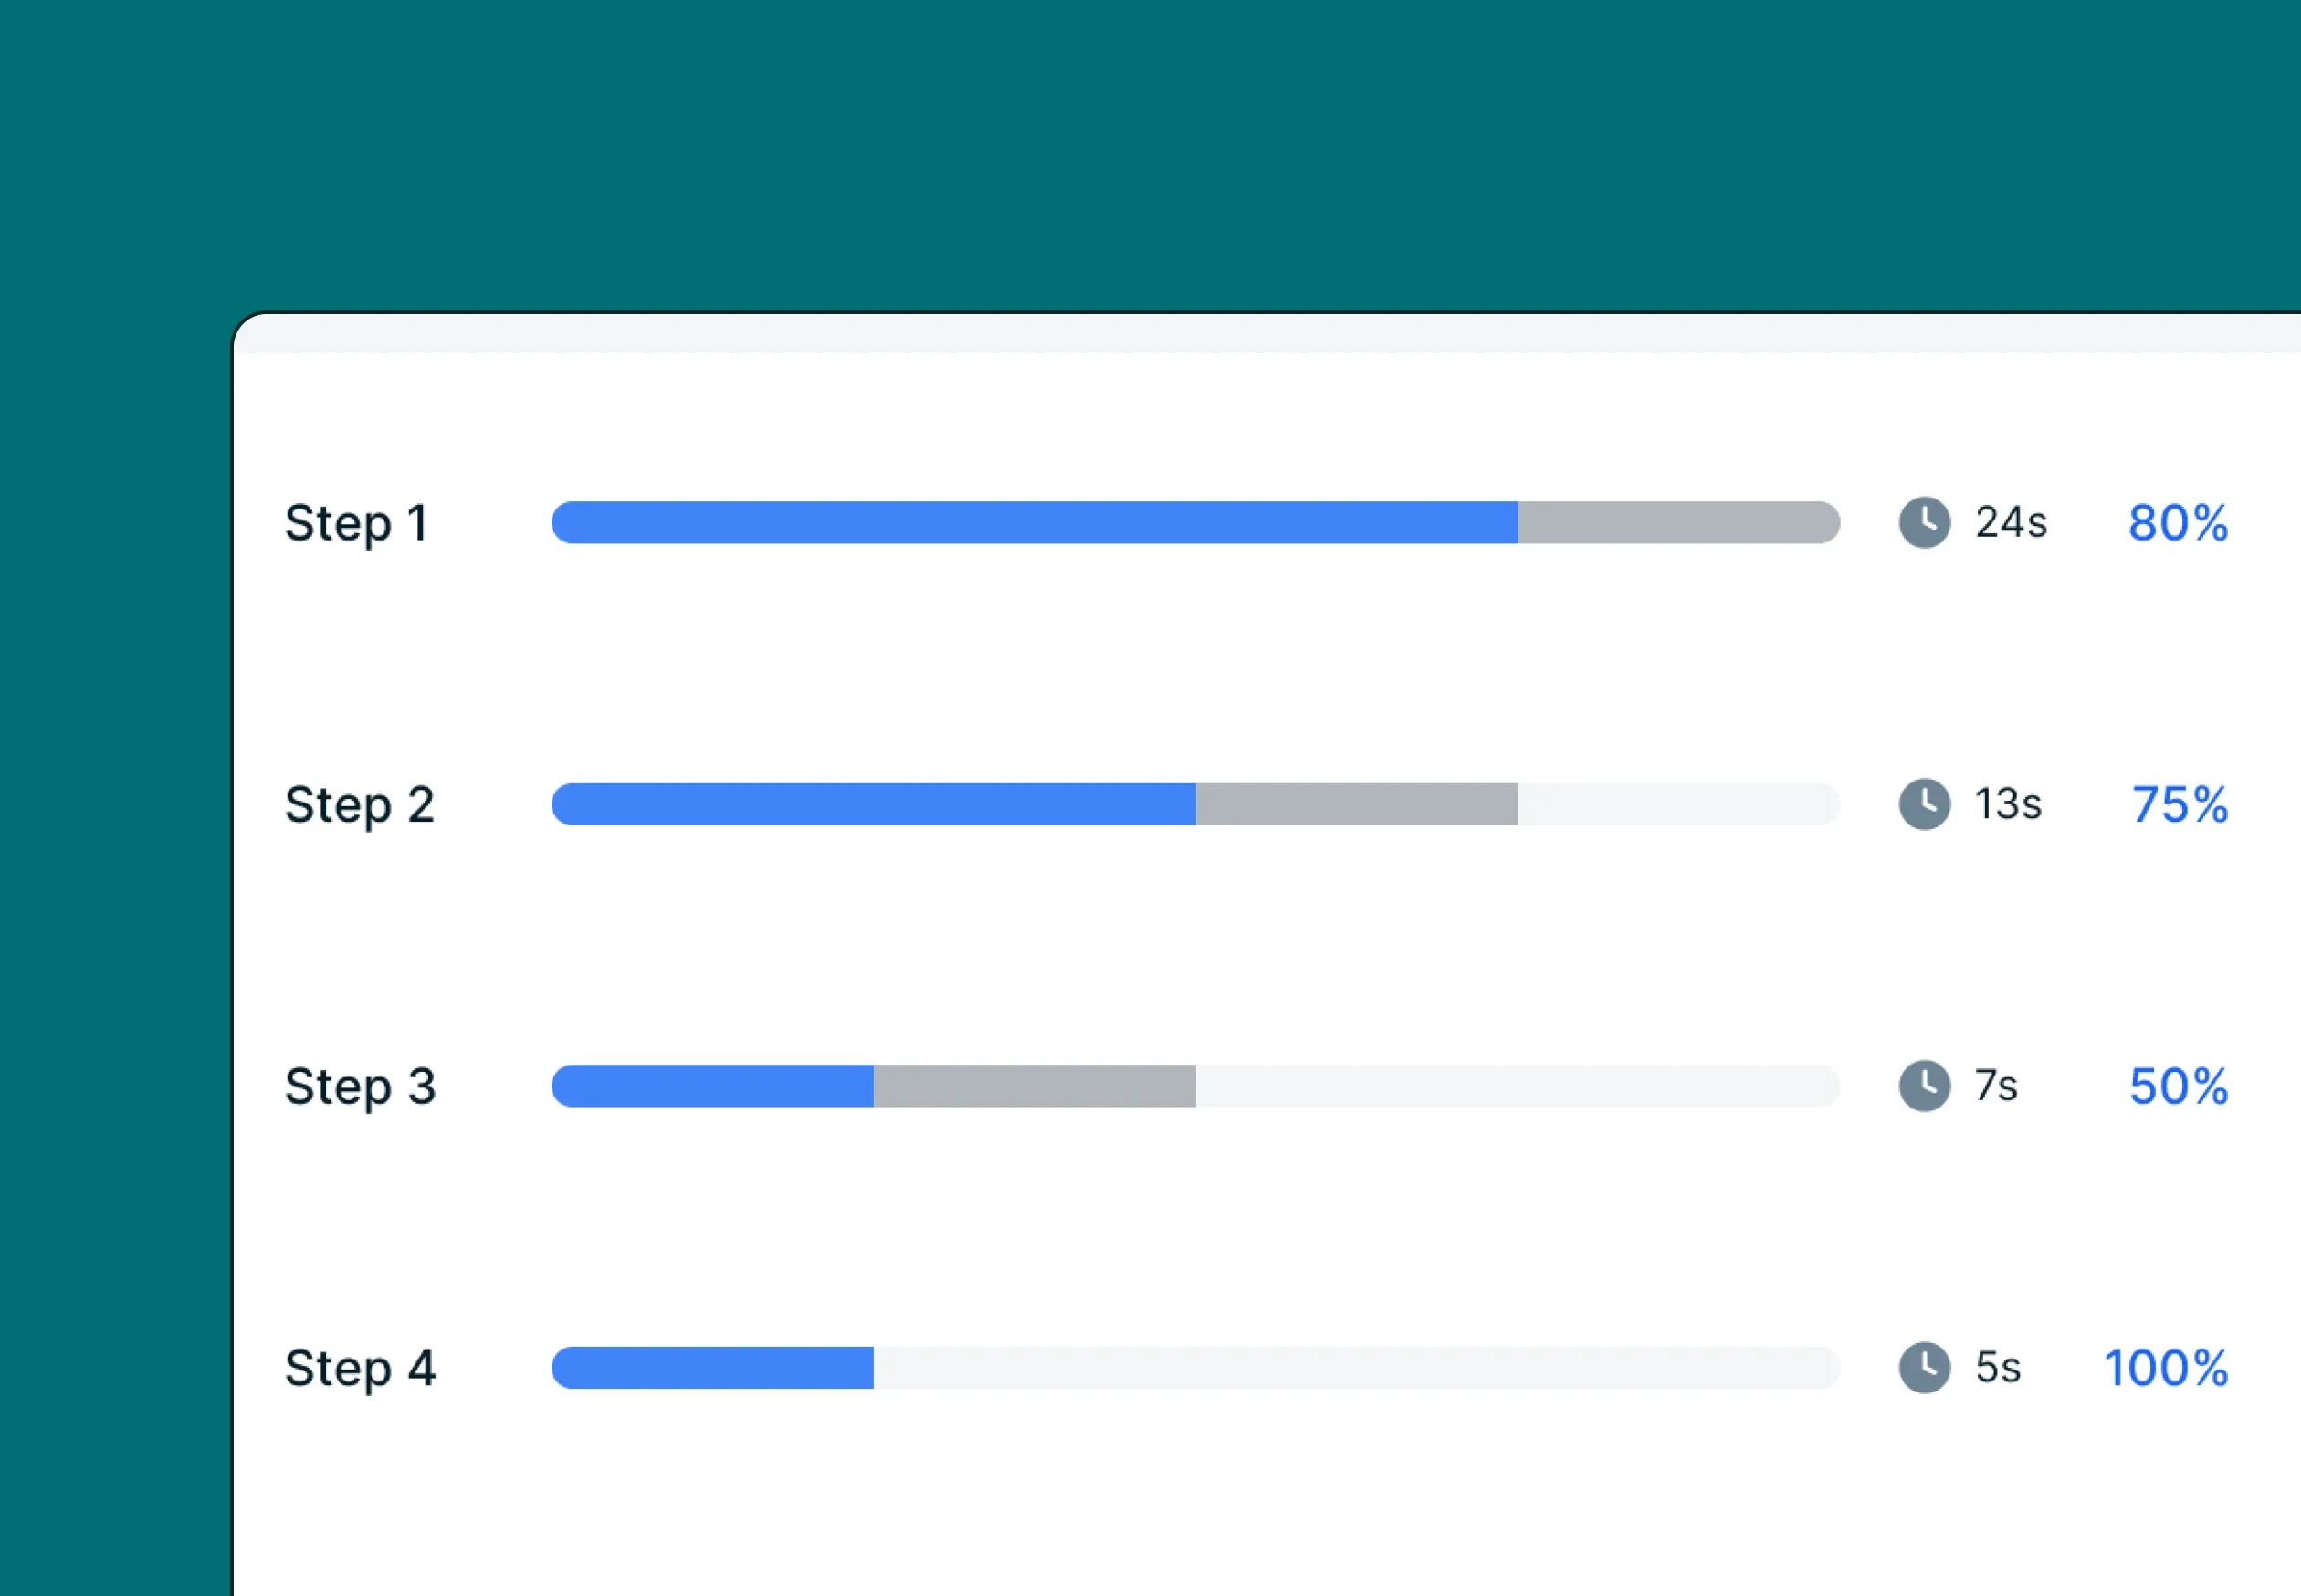
See how participants progress through each stage of a task, highlighting where drop-offs or completions occur.
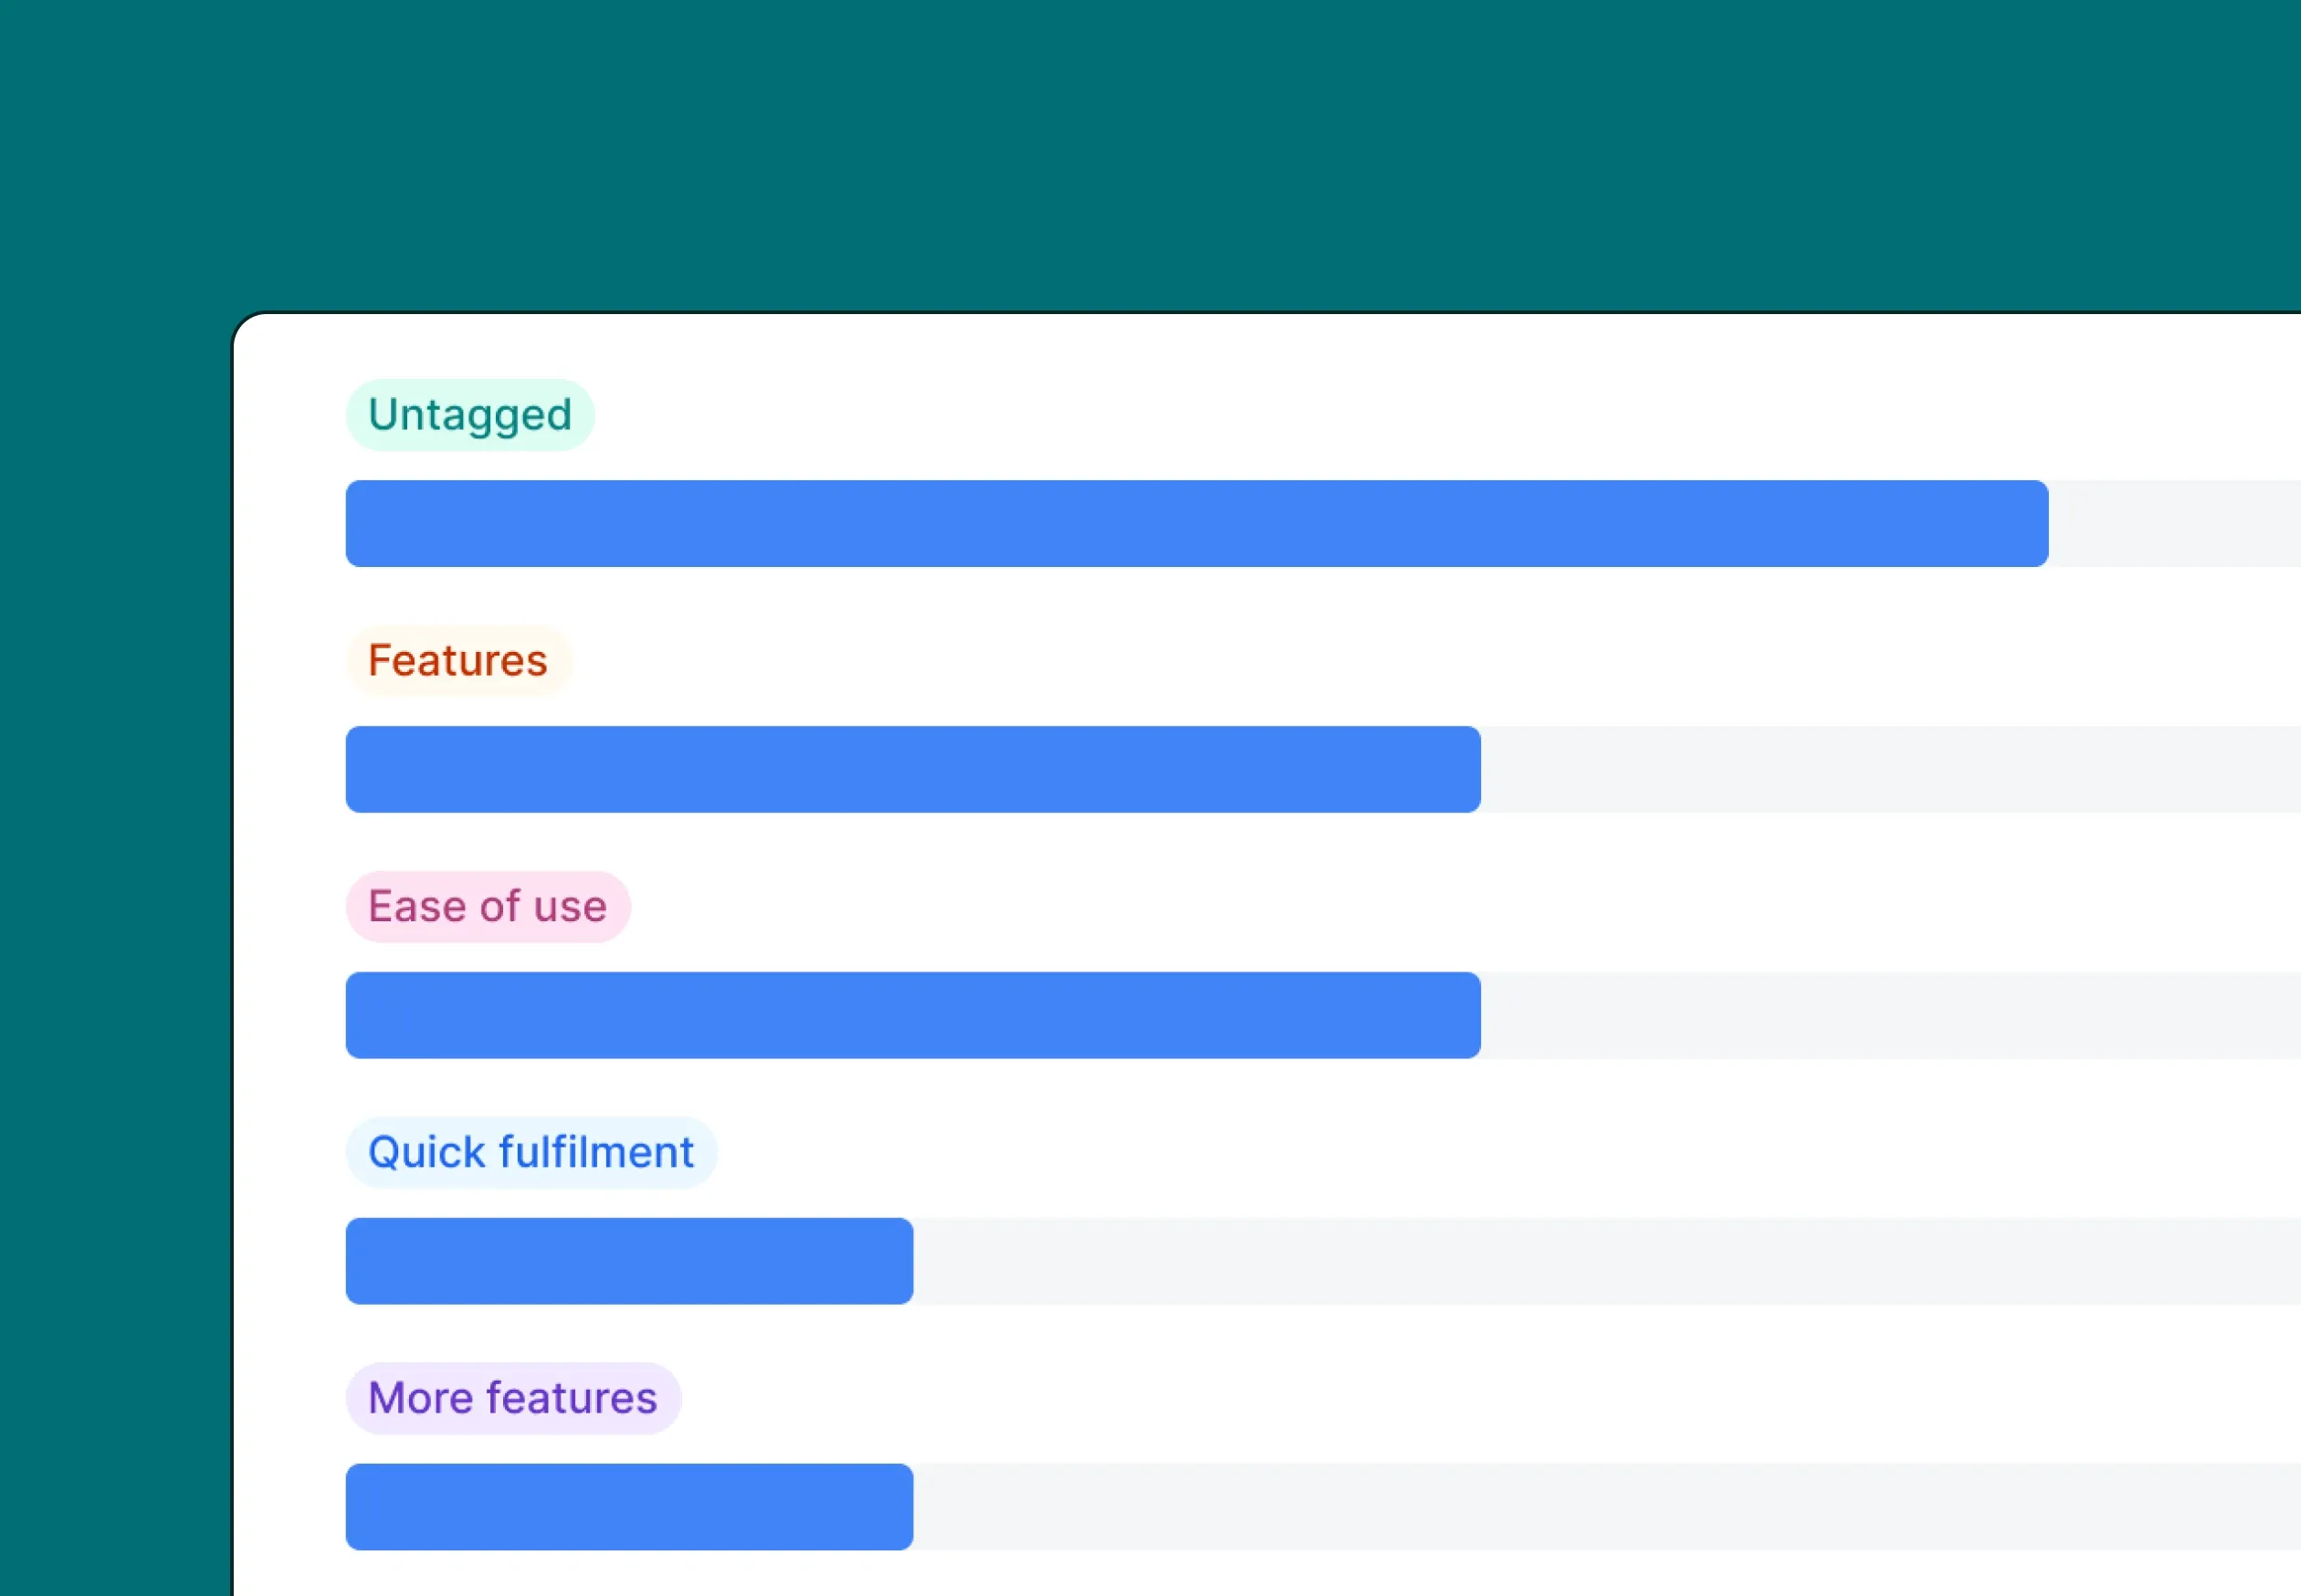
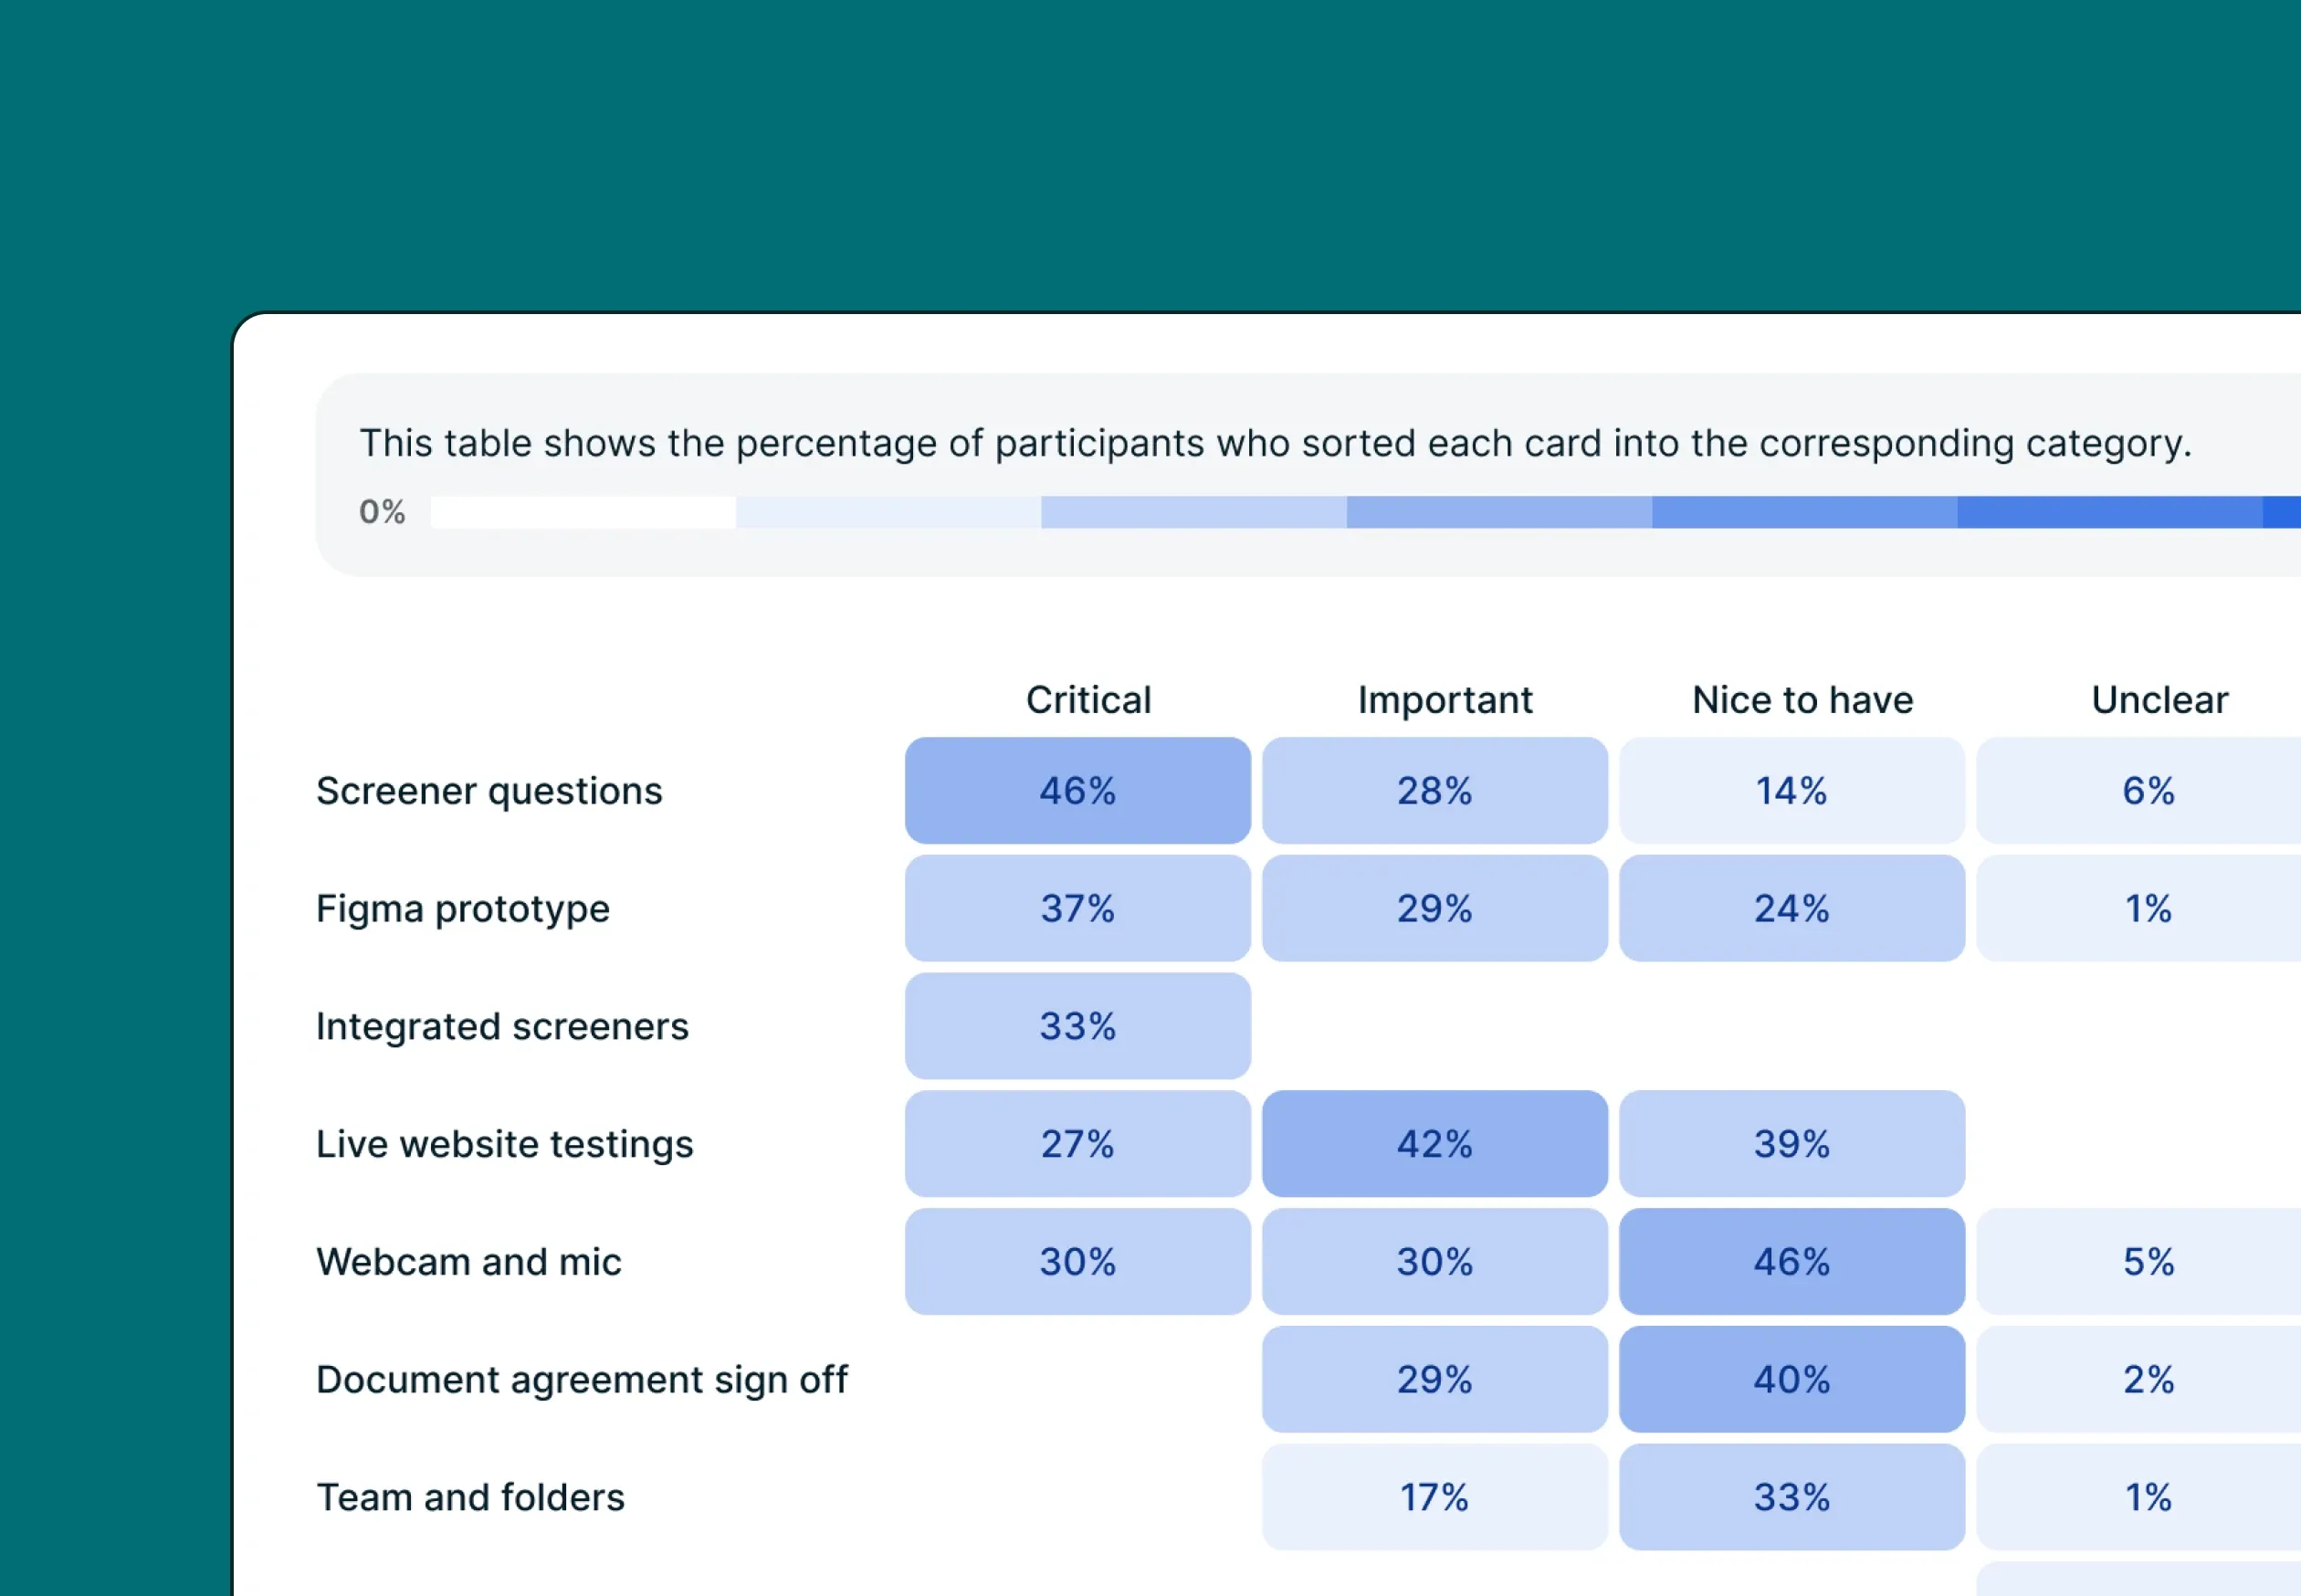
A bar chart of tagged responses grouping feedback by theme, making it easy to compare the frequency of key insights across participants.
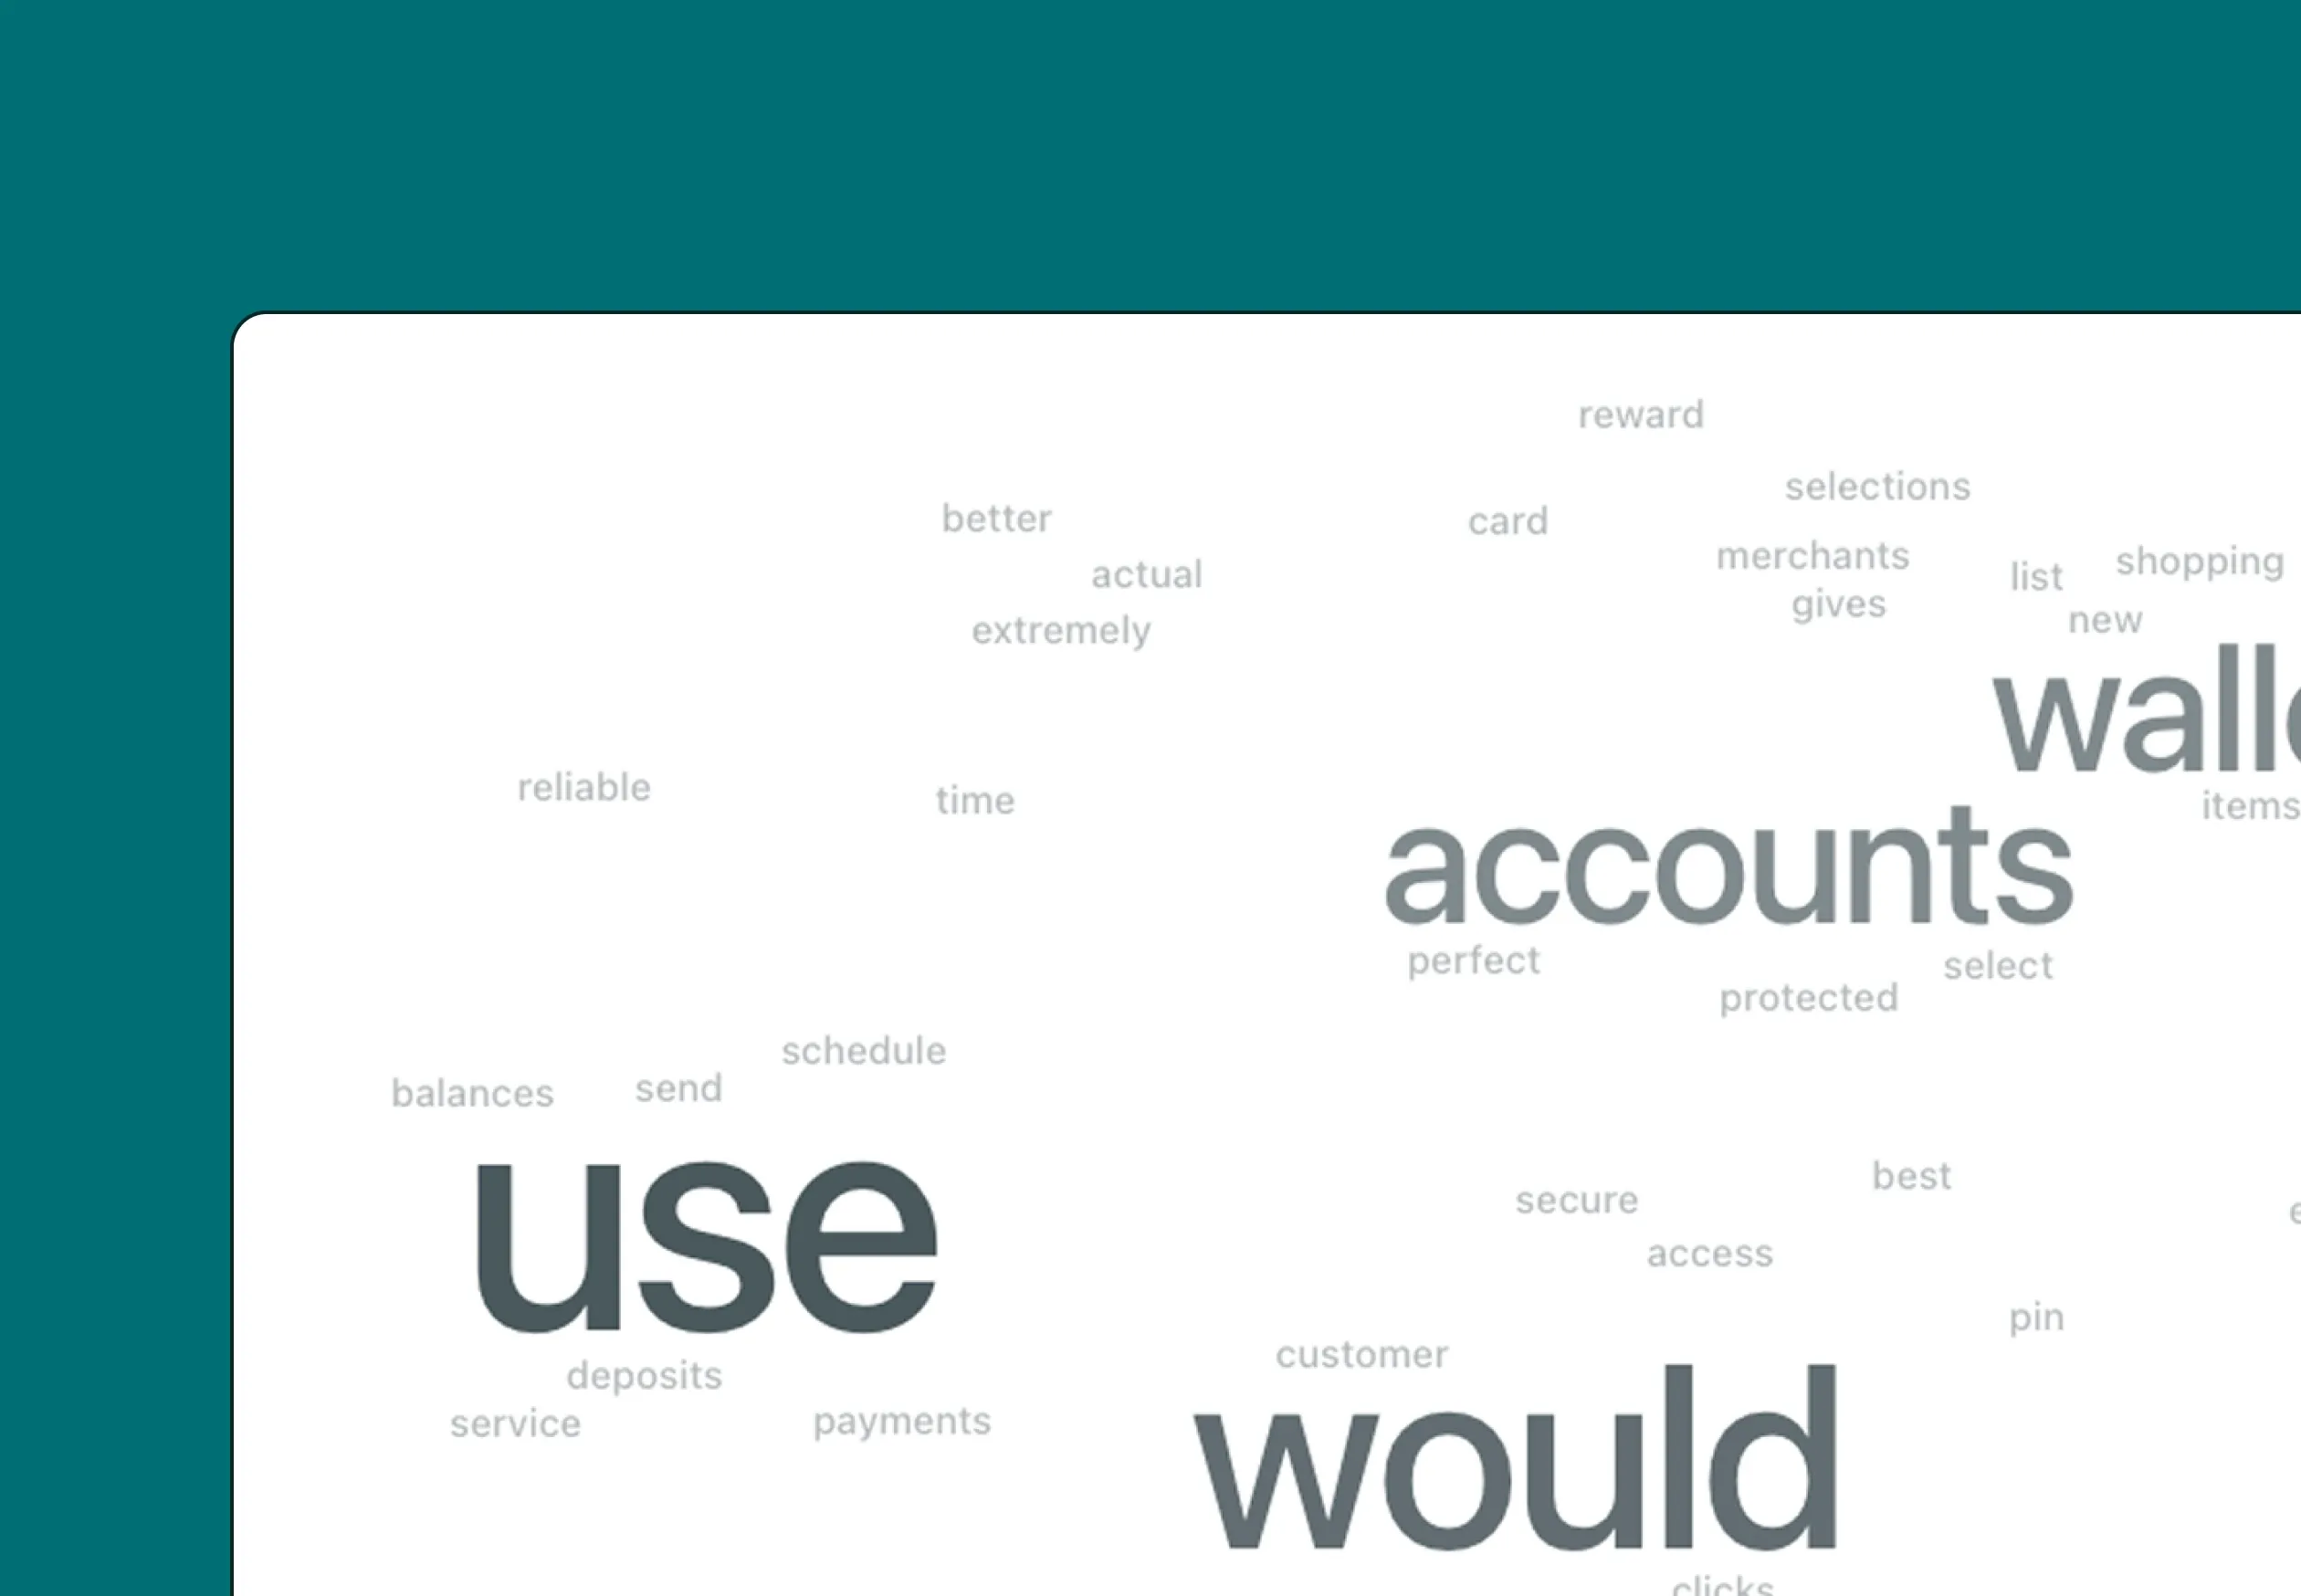
See at a glance the most frequently mentioned words in participant responses, with larger text indicating higher frequency.
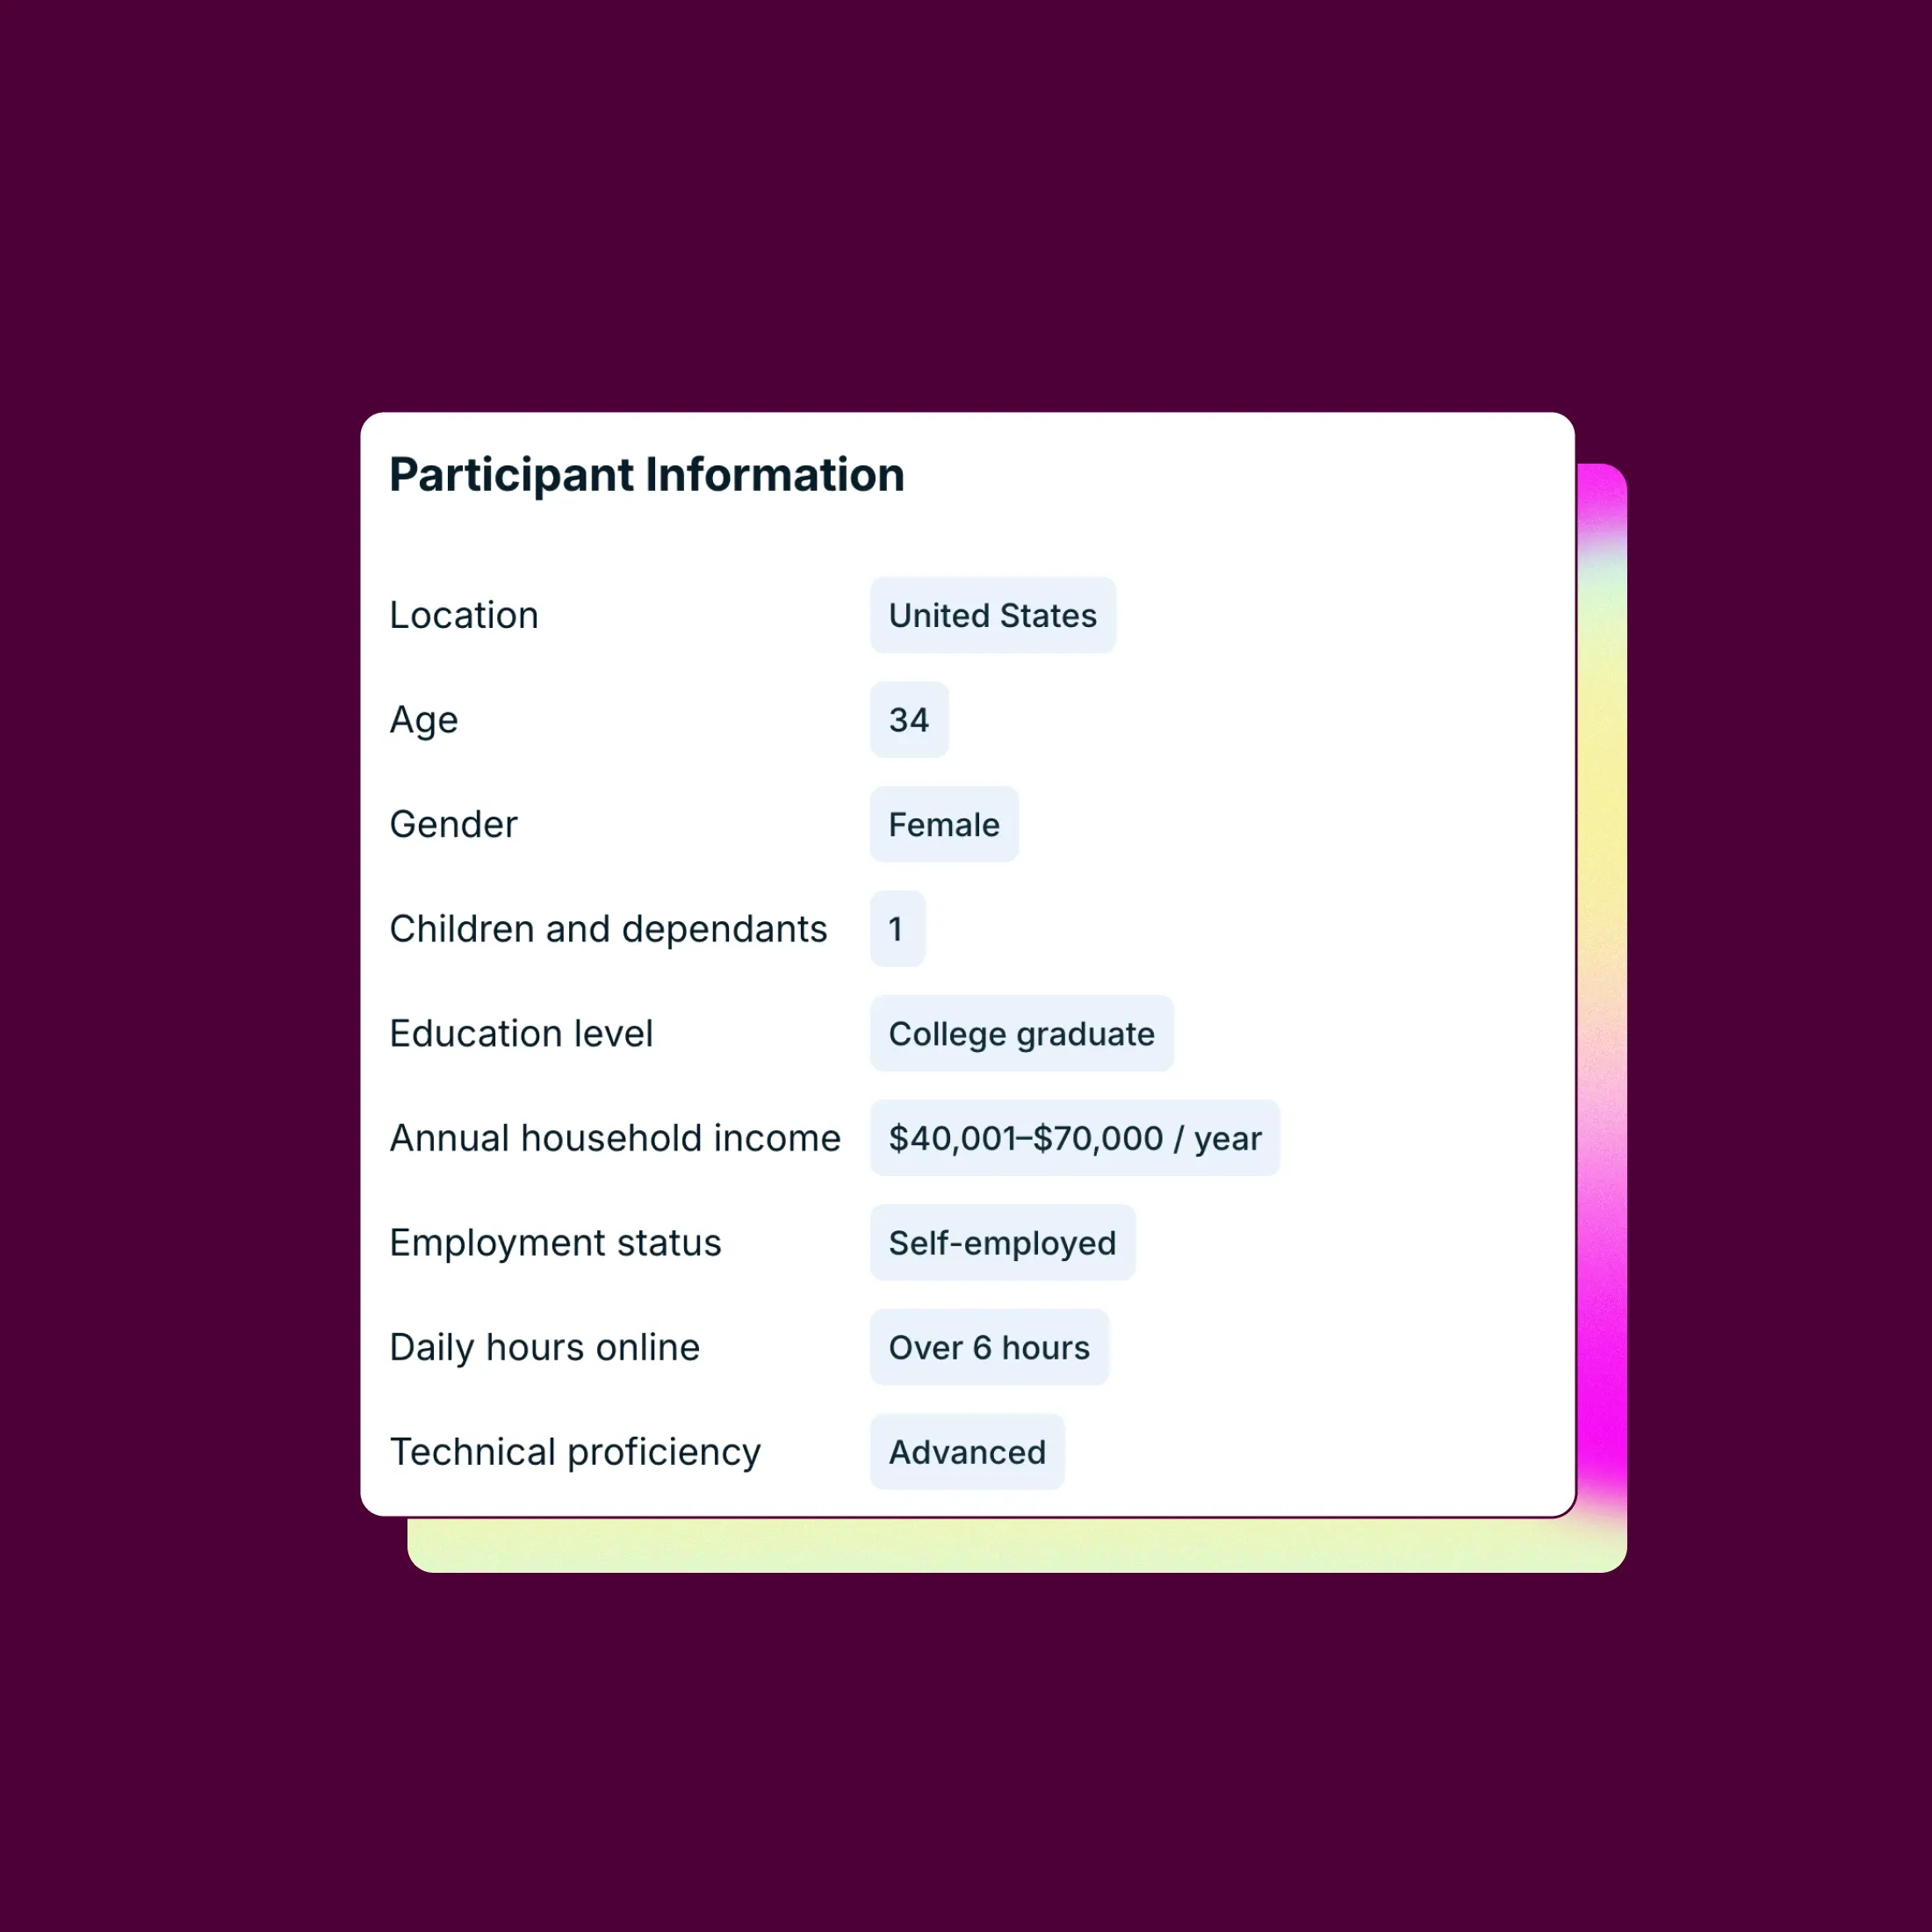
Zoom in with the participant drawer
View full participant profiles alongside their responses. See who said what—and why it matters.
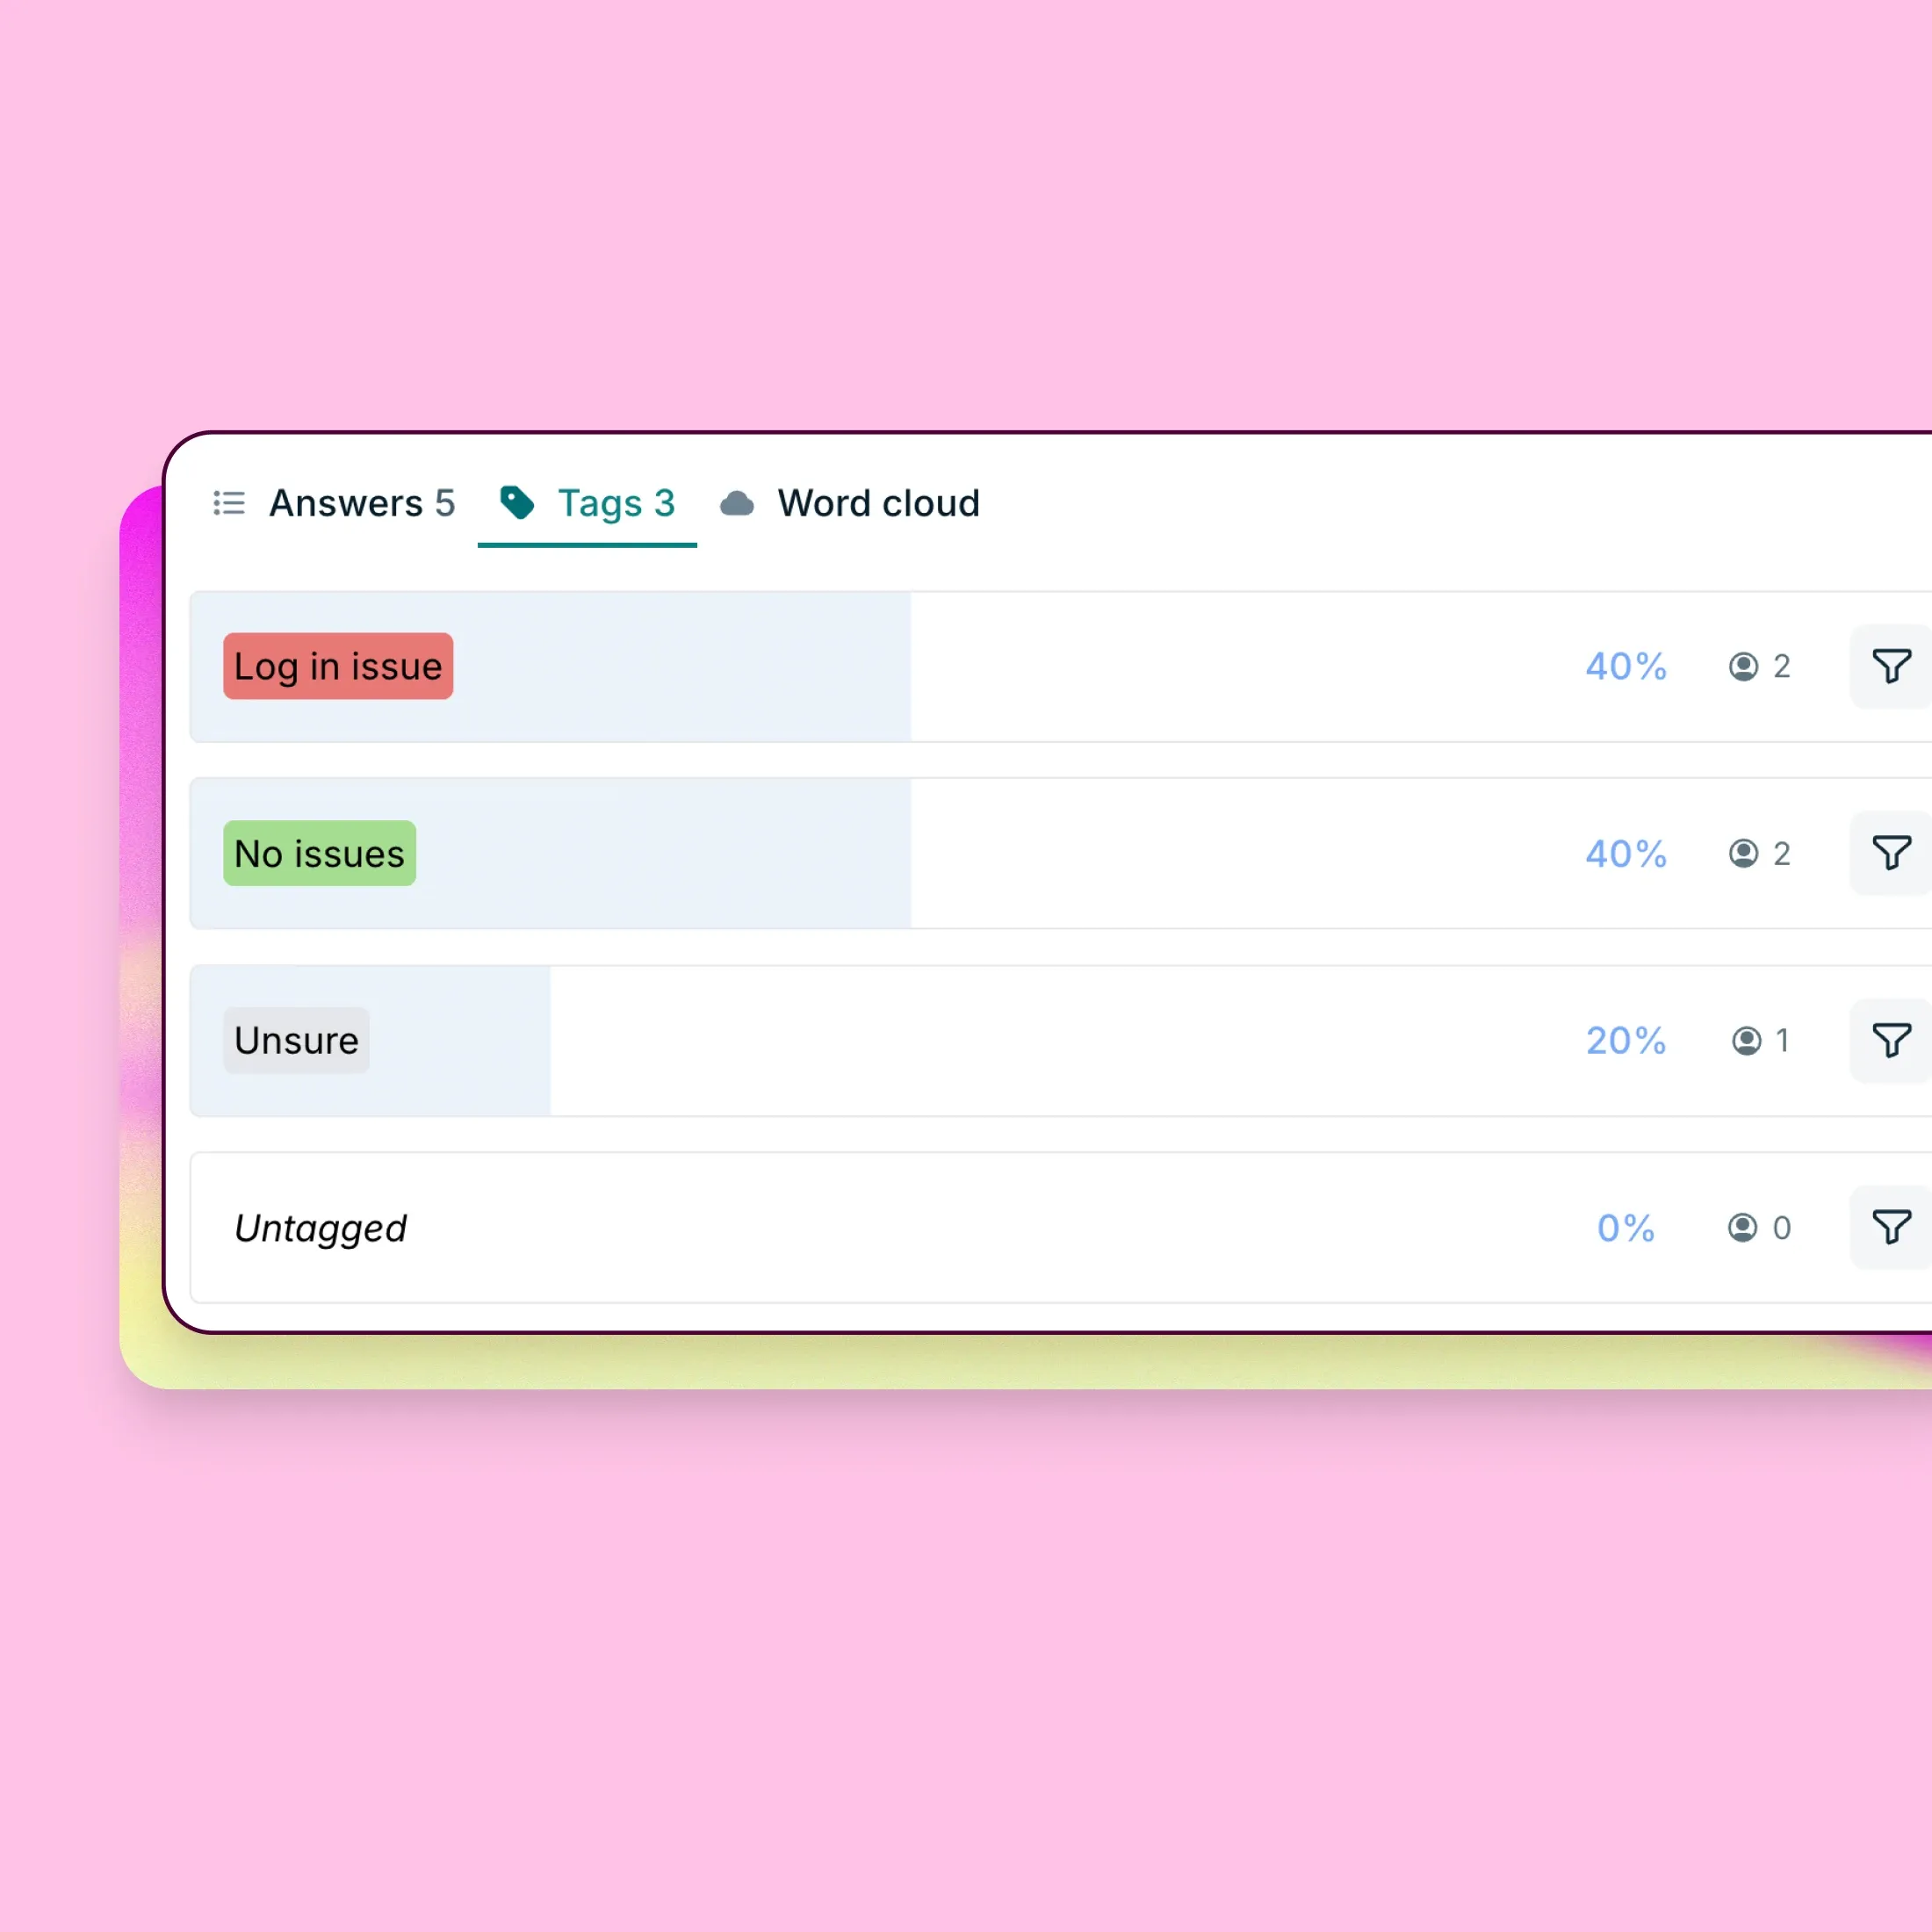
Tag responses for clearer insights
Make sense of open-ended feedback by tagging responses into meaningful themes, helping you uncover patterns and structure qualitative data for faster, easier analysis.
Search responses by keyword and apply tags in bulk
Create and assign tags as you review feedback
Filter results based on the tags you’ve applied
Our users say it better

We used to spend days collecting the data we can now get in an hour with Lyssna. We're able to get a sneak preview of our campaigns' performance before they even go live.

Aaron Shishler
Copywriter Team Lead at monday.com

A full-blown research project can take a lot of time and energy, but you can have meaningful early results from Lyssna in a single day. I think that’s one of the best benefits I’ve seen: faster and better iteration.

Alan Dennis
Product Design Manager at YNAB

Lyssna is a really great tool to help make decisions based on insights from users.
Hayad Ibrahim
UX Researcher at Eneco

Lyssna has become my go-to tool for quick surveys.

Sonal Malhotra
UX Research Lead at Klarna
We used to spend days collecting the data we can now get in an hour with Lyssna. We're able to get a sneak preview of our campaigns' performance before they even go live.
Aaron Shishler
Copywriter Team Lead at monday.com
A full-blown research project can take a lot of time and energy, but you can have meaningful early results from Lyssna in a single day. I think that’s one of the best benefits I’ve seen: faster and better iteration.
Alan Dennis
Product Design Manager at YNAB
Lyssna is a really great tool to help make decisions based on insights from users.
Hayad Ibrahim
UX Researcher at Eneco
Lyssna has become my go-to tool for quick surveys.
Sonal Malhotra
UX Research Lead at Klarna
Need help getting started?
Take a look at these resources

Frequently asked questions


Experience powerful research analysis today
Join over 320,000+ marketers, designers, researchers, and product leaders turning feedback into clarity. With Lyssna’s analysis tools, your next big insight is just a click away.
No credit card required